If you're a SaaS founder running a tight ship, your metrics decide where the next dollar and the next week of work go.
When you're trying to scale your SaaS, decisions made on gut feeling get expensive fast.
Take Slack. When it opened its preview in August 2013, 8,000 people requested an invitation on the first day, First Round Review reports. Demand was clear. Whether those teams would stay was a separate question, and Slack answered it with a usage threshold. Any team that had exchanged 2,000 messages had, in co-founder Stewart Butterfield's words, "really tried" Slack. Of those teams, 93% were still using it.
The invitation count measured curiosity. The 2,000-message line measured whether the product had earned a place in a team's day. That is the kind of number this guide is about.
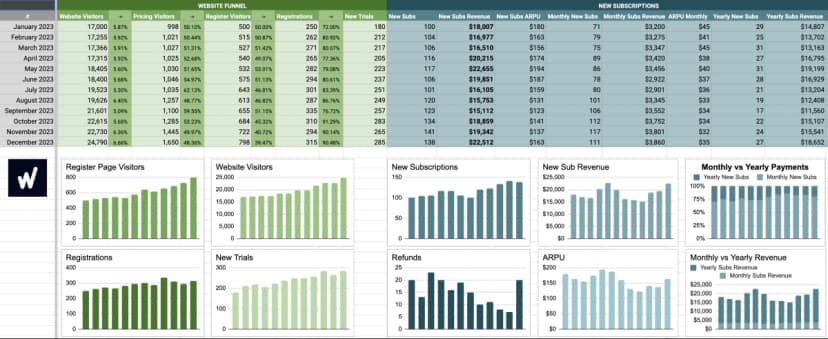
The guide follows the WeGrowth SaaS Growth Marketing Dashboard, a free Google Sheets template, block by block. For each metric you'll find what it measures, how to calculate it and what to do when it moves. It also covers how to set up tracking and why a weekly review beats checking numbers when you remember to.
How to Track SaaS Growth Marketing Metrics
Track your key performance indicators on a fixed cadence. The dashboard is built in weekly rows, each with a start date, an end date and a comment, and that rhythm is the one we recommend. Weekly reviews show a trend while there is still time to act on it. Monthly totals are useful as a rollup on top.
Two practices make the routine work.
→ Your Main Source of Truth: Spreadsheets
There are plenty of analytics tools, and most of them are good at one slice of the funnel. A spreadsheet puts every slice in one place.
Using a spreadsheet as your main source of truth keeps the numbers transparent and easy to manage. It also makes you handle the data yourself, which is how you get to know your company's performance KPIs.
The dashboard has two tabs:
- Metrics: one row per week, with columns for the website funnel, each ad channel, new subscriptions, renewals and revenue, and MRR. You can track New Subs Revenue, Conversion CAC and MRR Churn % side by side and spot trends over time.
- Events: the tracking plan. It lists every metric with a description, where the number comes from (Google Analytics, Google Tag Manager, the ad platform or Stripe) and how to implement it, including the Tag Manager event code for each funnel step and a checklist of triggers and tags.
Use the Comment column. Write down what changed that week: a campaign launch, a new pricing page, a tracking fix. When a number jumps three months later, the explanation is sitting next to it.
→ Manual Input Beats Passive Observation
You might wonder why you should type your SaaS metrics into a sheet every week when your analytics platforms already show them.
The reason is engagement and focus. Entering the numbers yourself makes you look at each one, compare it with last week and ask why it moved.
A weekly review of your SaaS growth marketing metrics takes you into the core of your growth drivers. You understand the nuances of your performance, spot anomalies sooner and iterate on your strategy faster. Occasional glances at a dashboard rarely produce the same insight or the same urgency to act.
With a dedicated routine, your metrics get recorded, analyzed, discussed and acted on, and that is what leads to better decisions and steadier growth.
Product-Led or Sales-Led: Choose the Funnel You Track
Before you fill in the dashboard, decide which path your customers take to pay you.
- Product-led. Visitors sign up, try the product on their own and subscribe, usually after a free trial. Your funnel runs through signups and onboarding steps.
- Sales-led. Visitors request a demo, a salesperson runs the call and sends a proposal, and the deal closes. Your funnel runs through demo calls.
Many SaaS companies run both: self-serve signups for smaller customers and demos for larger ones. In that case, track both funnels side by side.
The dashboard handles either motion. Its funnel columns are numbered steps that you label for your own process. Section 1 below covers the product-led funnel and section 2 the sales-led one.
Which SaaS Metrics to Measure and Why
SaaS businesses depend on their data, but some numbers matter far more than others. Focusing on the right ones makes a real difference to how well you scale.
1. Website Funnel Metrics (Product-Led)
Your website is where potential customers form their first impressions and begin their journey toward becoming customers.
Tracking the right SaaS metrics here shows how well your site performs and where to optimize for growth. In the dashboard, each funnel step has a rate column next to it, calculated against Website Visitors. That gives you one consistent baseline: of everyone who came to the site this week, what share reached this step?
Let's break down the KPIs you need to focus on:
🔹 Website Visitors
- Definition: Total number of people who visit your site.
- Why It Matters: It's your top-of-funnel metric and the baseline for every rate below. High visitor numbers are great, but they mean little if they don't lead to signups.
- Actionable Insight: Use Google Analytics to find high-traffic pages with low conversion. Adjust the content or calls to action (CTAs) on those pages first.
🔹 Pricing/Register Visitors
- Definition: People who reach your pricing or registration page, a sign of serious interest.
- Formula: Pricing/Register Visitors ÷ Website Visitors × 100
- Why It Matters: A low share here can point to a disconnect between your messaging and the visitor's need, or to a path that's hard to find.
- Actionable Insight: Test clear, benefit-led CTAs and the routes that lead to your pricing page. Our guide to improving landing page conversion rates covers the tactics in detail.
🔹 Steps 1–6: Signup and Onboarding
- Definition: Up to six steps you define, each tracked as a Google Tag Manager event. Most teams make Step 1 the signup itself. The steps after it are the actions that show a new user is getting value: connecting data, inviting a teammate, finishing a first project.
- Formula: Step count ÷ Website Visitors × 100, for each step
- Why It Matters: Signups alone tell you people were curious. The onboarding steps tell you whether they found a reason to stay, which is what Slack's 2,000-message threshold measured.
- Actionable Insight: Look for the step with the steepest drop from the one before it. If many people sign up and few reach Step 2, simplify the signup form, cut fields to the essentials and consider social sign-up. If they stall later, use in-app messages and onboarding emails to guide them to the step they're missing.
🔹 Conversions
- Definition: Visitors who complete the final step of the funnel and become paying subscribers.
- Formula: Conversions ÷ Website Visitors × 100
- Why It Matters: This is the milestone the rest of the funnel builds toward. Quantity matters, and so does quality.
- Actionable Insight: Compare conversions by acquisition channel. Put more budget behind the sources that bring subscribers who stay.
2. Demo Call Metrics (Sales-Led)
In a sales-led funnel, the demo call is where interest becomes a deal. In the dashboard, label the funnel steps as your demo path: demo page visitors, demos requested, demos booked, demos completed and opportunities. Closed deals and their value usually come from your CRM or a simple leads log, matched back to the demo.
These metrics show how well your marketing fills the calendar and how well your team turns calls into customers.
🔹 Demo Page Visitors
- Definition: The number of people who visit your demo request page.
- Formula: Demo Page Visitors ÷ Website Visitors × 100
- Why It Matters: It shows how much interest your marketing creates in a conversation with sales. Volume alone can mislead, so watch it alongside the requests it produces.
- Actionable Insight: If many people reach the demo page and few request a demo, review the page itself: the promise of the call, the length of the form and what happens after they submit.
🔹 Demos Requested
- Definition: The number of demo requests submitted.
- Formula: Demos Requested ÷ Demo Page Visitors × 100
- Why It Matters: This is usually the conversion your ads are optimized for in a sales-led funnel, so it links your ad spend to your pipeline.
- Actionable Insight: Make requesting easy. Fewer form fields and a clear next step lift the request rate.
🔹 Demos Booked
- Definition: The number of requests that become a scheduled call.
- Formula: Demos Booked ÷ Demos Requested × 100
- Why It Matters: The gap between requested and booked is a drop-off many teams never measure. A request that never turns into a time slot is a lead you paid for and lost.
- Actionable Insight: Let people pick a time in the same flow as the request, and follow up quickly on requests that don't book.
🔹 Demos Completed
- Definition: The number of demo calls that took place, regardless of the outcome.
- Why It Matters: A completed demo is the first real sales conversation. Tracking it shows whether interest holds up until the call.
- Actionable Insight: Send reminder emails or text messages before the call, along with a short, personal note about what the prospect will see.
🔹 Demo Show-Up Rate
- Definition: The percentage of booked demos the prospect attends.
- Formula: Demos Completed ÷ Demos Booked × 100
- Why It Matters: A low show-up rate wastes your team's time and becomes a bottleneck in the sales process.
- Actionable Insight: Experiment with follow-up between booking and the call. Reminders that restate what the prospect will get from the demo usually work better than a bare calendar invite.
🔹 Opportunities
- Definition: Completed demos that move forward to a pricing proposal.
- Formula: Opportunities ÷ Demos Completed × 100
- Why It Matters: It separates calls that went well from calls that went somewhere. A steady demo count with few opportunities points to a fit or qualification problem.
- Actionable Insight: Check what the prospects who reach a proposal have in common, such as company size, role or source, and qualify for those traits before the call.
🔹 Demo Purchases
- Definition: The number of prospects who buy after attending a demo.
- Why It Matters: It measures how well your demos and follow-up turn interested leads into customers.
- Actionable Insight: If purchases are low, review your demo script and process. Make sure the team connects the product to the pain points the prospect raised.
🔹 Demo Purchase Amount
- Definition: The total revenue from purchases made by prospects who attended a demo.
- Why It Matters: It shows the financial impact of your demo calls and whether they bring in high-value customers.
- Actionable Insight: If the amount is lower than expected, look at which packages you present on the call, and highlight the features that justify a higher tier.
🔹 Demo Call Conversion Rate
- Definition: The percentage of demo attendees who become paying customers.
- Formula: Demo Purchases ÷ Demos Completed × 100
- Why It Matters: It shows how persuasive and effective your demo process is.
- Actionable Insight: Train your team to tailor each demo to the prospect's needs. Use stories and examples from customers like them.
3. Advertising Metrics
Advertising metrics show which campaigns work and where your budget should go. The dashboard tracks four channels: Facebook Ads, LinkedIn Ads, Google Ads and Reddit Ads. Each has the same columns, so the metrics are defined once below, followed by notes on each channel.
What counts as a conversion depends on your funnel. In a product-led funnel it's a signup or a new subscription. In a sales-led funnel it's a demo request, so Conversion CAC becomes your cost per demo request, and revenue for the channel arrives later, when deals close.
🔹 Traffic
- Definition: The number of visitors the channel sends to your website or landing page.
- Why It Matters: High traffic from ads is great, but you need to assess its quality. Are these visitors converting, or bouncing off your site?
- Actionable Insight: Compare each channel's traffic with its conversions. A channel that sends many visitors and few conversions needs a closer match between the ad and the page it leads to.
🔹 Spend
- Definition: The total amount spent on the channel during the week.
- Why It Matters: It's the input every efficiency metric below divides by.
- Actionable Insight: Review spend against results every week. If a campaign isn't delivering, move its budget to one that is.
🔹 CPC (Cost per Click)
- Definition: The average cost of one click on your ad.
- Formula: Spend ÷ Traffic
- Why It Matters: A rising CPC eats into your budget. It can mean your targeting is off or your ads aren't resonating, though in B2B a high CPC often reflects a competitive audience.
- Actionable Insight: A/B test ad creative and audience segments. On search, use negative keywords to filter out irrelevant clicks.
🔹 Conversions
- Definition: The number of conversions attributed to the channel.
- Why It Matters: It shows whether your ads drive the action you care about.
- Actionable Insight: Find the campaigns and ad sets that drive the most conversions and put more behind them. If conversions are low, test different landing pages or messaging.
🔹 Conversion CR (Conversion Rate)
- Definition: The share of ad visitors who convert.
- Formula: Conversions ÷ Traffic × 100
- Why It Matters: A low conversion rate can suggest a mismatch between your ad and your landing page, or an unclear call to action.
- Actionable Insight: Align the landing page with the promise in the ad, and test variations of both.
🔹 Conversion CAC (Customer Acquisition Cost)
- Definition: The cost of one conversion from the channel.
- Formula: Spend ÷ Conversions
- Why It Matters: It tells you whether the channel's spend is sustainable at the volume you need.
- Actionable Insight: If CAC is too high, revisit your ad funnel, target higher-intent audiences and shorten the path to conversion. Our guide on how to lower customer acquisition costs covers how to find the stage driving it up.
🔹 Revenue
- Definition: The revenue from conversions attributed to the channel.
- Why It Matters: It shows the direct financial impact of your advertising.
- Actionable Insight: Compare revenue with spend for each channel. If revenue isn't growing with spend, adjust your targeting and creative before adding budget.
🔹 Instant Profit
- Definition: Revenue from the channel after subtracting ad spend.
- Formula: Revenue − Spend
- Why It Matters: It shows whether the channel paid for itself in the week the revenue came in. Each weekly row counts only the revenue attributed in that week, so renewals in later weeks aren't included. A channel whose subscribers renew for a year can show negative Instant Profit for a while and still earn its spend back.
- Actionable Insight: Read Instant Profit next to your renewal data. Put more budget behind channels that recover their spend quickly or bring subscribers who stay.
🔹 Instant ROAS (Return on Ad Spend)
- Definition: The revenue earned for every dollar spent on the channel.
- Formula: Revenue ÷ Spend
- Why It Matters: It shows how well your ads turn spend into revenue. The same weekly caveat applies as for Instant Profit.
- Actionable Insight: If ROAS is below target, review targeting, bidding and creative. Small changes to any of them can move it.
🔹 % Of Signups and % Of Subs
- Definition: The channel's share of the week's signups and of the week's new subscriptions. In a sales-led funnel, track the share of demo requests instead.
- Formula: Channel Conversions ÷ total Signups (or New Subs) × 100
- Why It Matters: It shows how dependent your growth is on each channel. Ad platforms can claim the same customer, so the shares across channels can add up to more than 100%.
- Actionable Insight: If one channel brings most of your customers, start testing a second before you need it.
🔹 Notes by Channel
- Facebook Ads: Audiences are broad, and creative does most of the targeting work. Refresh ads regularly and track landing page views as well as clicks in Meta Ads Manager.
- LinkedIn Ads: You can target by job title, company size and industry, which suits B2B. Clicks cost more than on most channels, so judge LinkedIn on Conversion CAC rather than CPC.
- Google Ads: Search reaches people who are already looking for a solution. Watch which keywords bring quality traffic, and bid on the ones that convert.
- Reddit Ads: Ads appear inside topic communities. Match the tone of the community you're targeting, and watch Conversion CR closely while you find the right fit.
🔹 ADS Conversion CAC and Ads Instant Profit
- Definition: Your combined acquisition cost and combined Instant Profit across all four channels.
- Formula: ADS Conversion CAC = total spend across channels ÷ total conversions across channels. Ads Instant Profit = the sum of each channel's Instant Profit.
- Why It Matters: It shows what paid acquisition costs you as a whole. Divide total spend by total conversions; averaging the four channel CACs gives a different and misleading number.
- Actionable Insight: If total CAC is unsustainable, compare the channels and move budget toward the ones delivering better returns.
To find the highest CAC your customer lifetime value can support, use the free SaaS unit economics calculator.
4. New Subscription Metrics
New subscription metrics show how well your marketing and sales turn interest into paying customers. The count matters, and so do the quality and revenue of those subscriptions. In the dashboard, these numbers come from Stripe or your billing system.
🔹 New Subscriptions
- Definition: The total number of new subscriptions in the period.
- Monthly New Subs: New subscriptions on a monthly plan.
- Yearly New Subs: New subscriptions on a yearly plan.
- Why It Matters: It reflects the effectiveness of your marketing and sales. The split between plans also shows how much cash you collect up front.
- Actionable Insight: Find the channels that bring the most new subscribers, and the ones whose subscribers choose yearly plans, and put more behind them.
🔹 New Subscriptions Revenue
- Definition: Revenue from new subscriptions in the period.
- Monthly Subs Revenue: Revenue from new monthly-plan subscriptions.
- Yearly Subs Revenue: Revenue from new yearly-plan subscriptions.
- Why It Matters: It drives your cash flow and short-term financial health.
- Actionable Insight: Segment revenue by customer type to see where the most value comes from, and shape your acquisition strategy around it.
🔹 New Subscriptions ARPU
- Definition: Average revenue per new subscription. It helps you check whether your pricing matches the value customers get.
- ARPU Monthly: Average revenue per new monthly-plan subscription.
- ARPU Yearly: Average revenue per new yearly-plan subscription.
- Formula: New Subs Revenue ÷ New Subs (and the same for each plan)
- Why It Matters: A low ARPU can point to underpricing or to many low-value customers.
- Actionable Insight: Test pricing and packaging changes, such as feature tiers or a discount for paying yearly, and watch how ARPU responds.
5. Renewal, Upgrade and Revenue Metrics
Long-term success depends on keeping customers and growing revenue from them, as well as on winning new ones.
These SaaS metrics show how well you retain customers and grow what they spend with you.
🔹 Renewals
- Definition: The number of subscriptions that renew in the period.
- Monthly Renewals: Renewals of monthly-plan subscriptions.
- Monthly Ren. Revenue: Revenue from monthly-plan renewals.
- Yearly Renewals: Renewals of yearly-plan subscriptions.
- Yearly Ren. Revenue: Revenue from yearly-plan renewals.
- Total Renewal Revenue: Revenue from all renewals, monthly and yearly.
- Why It Matters: Steady renewals make revenue predictable. A high renewal rate signals loyal customers.
- Actionable Insight: If renewals drop, ask customers why and fix the pain points they name.
🔹 Upgrades
- Definition: Customers moving to a higher-tier plan.
- Upgrades: The number of upgrades in the period.
- Upgrades Revenue: The revenue from those upgrades.
- Why It Matters: It shows how much you can grow revenue without acquiring new customers.
- Actionable Insight: Use product usage data to time upgrade offers, and highlight the features each customer is closest to needing.
🔹 Gross and Net Revenue
- Definition: Gross Revenue is the total revenue for the period before any deductions. Net Revenue is what remains after refunds and other adjustments.
- Formula: Net Revenue = Gross Revenue − Refunded Revenue − other adjustments
- Why It Matters: Gross Revenue shows the scale of your business. Net Revenue shows how much of it you keep. A widening gap between the two is an early warning.
- Actionable Insight: When the gap grows, look at refunds first, then at other adjustments such as discounts and failed payments.
🔹 Refunds
- Definition: How much revenue you lose to refunds. It is also a signal of customer satisfaction and of how well the product matches what your marketing promised.
- Refunded: The number of refunded subscriptions.
- Refunded Revenue: The revenue lost to those refunds.
- Why It Matters: High refund rates hurt your finances and can point to problems with the product or with your marketing promises.
- Actionable Insight: If refunds rise, dig into the reasons. Do customers feel misled by your marketing? Are there bugs or gaps in the product?
6. MRR, Churn and Other Recurring Revenue Metrics
These SaaS growth marketing metrics give you a clear view of your financial health and show where growth is working and where it's slipping. Together they form a simple equation:
End MRR = Start MRR + New MRR + Reactivations + Expansion − Churned MRR
🔹 Start MRR
- Definition: The monthly recurring revenue (MRR) you have at the beginning of the period.
- Why It Matters: It's the baseline for judging how well your strategies grow revenue or limit churn.
- Actionable Insight: Use Start MRR as the benchmark for the period. If growth stalls, look at acquisition, retention and expansion in turn to find the weak spot.
🔹 New MRR
- Definition: MRR from brand-new subscriptions in the period.
- Why It Matters: It reflects how well your customer acquisition is working.
- Actionable Insight: If New MRR is lower than expected, trace it back through the funnel: are fewer people converting, or are they choosing cheaper plans?
🔹 Reactivations
- Definition: MRR recovered from customers who churned and later resubscribed.
- Why It Matters: It adds to your MRR without the full cost of acquiring a new customer.
- Actionable Insight: Run win-back campaigns for former customers. Personal outreach or a specific offer can bring churned users back.
🔹 Expansion
- Definition: The increase in MRR from existing customers upgrading their plans.
- Why It Matters: It shows how well your product keeps delivering value and how well your upsell works.
- Actionable Insight: Use product usage data to spot customers ready for a higher tier, and reach them with targeted upgrade campaigns.
🔹 Churned MRR
- Definition: MRR lost to cancellations and downgrades in the period.
- Why It Matters: It shows what churn costs you, which makes it central to understanding and fixing retention.
- Actionable Insight: Find out why customers leave or downgrade. Use what you learn to improve the product and support.
🔹 MRR Churn %
- Definition: The percentage of your starting MRR lost to churn in the period.
- Formula: Churned MRR ÷ Start MRR × 100
- Why It Matters: It's a key measure of revenue loss and of how stable your business is.
- Actionable Insight: When MRR Churn % rises, look at onboarding, product value and ongoing support, in that order.
🔹 End MRR
- Definition: Total MRR at the end of the period, after every change.
- Formula: Start MRR + New MRR + Reactivations + Expansion − Churned MRR
- Why It Matters: It's the most complete single indicator of your revenue health.
- Actionable Insight: If End MRR isn't rising, check each part of the equation to see which one is underperforming: new sales, reactivations, expansion or churn.
🔹 New Net MRR
- Definition: The net MRR you gained in the period, after churn.
- Formula: New MRR + Reactivations + Expansion − Churned MRR (equal to End MRR − Start MRR)
- Why It Matters: It tells you whether the period was net positive and how efficiently your MRR is growing.
- Actionable Insight: If New Net MRR is low, compare what you added with what you lost. Often the faster fix is reducing churn or growing expansion.
🔹 MRR Growth
- Definition: The percentage change in MRR over the period.
- Formula: New Net MRR ÷ Start MRR × 100
- Why It Matters: It's the headline measure of whether your efforts to scale are working.
- Actionable Insight: Keep acquisition, retention and expansion in balance. Review the trend each period and adjust before growth flattens.
To see where your new MRR and churn will take your ARR, and what it takes to hit a target, try the free SaaS growth calculator.
Conclusion
The SaaS growth marketing metrics you choose to prioritize shape the decisions your company makes.
Tracking KPIs like MRR, CAC and churn with precision gives you insights that should inform every part of the business, from acquisition strategy to customer retention and upsell.
In a competitive market, gut feeling and anecdotes won't carry you far. The companies that thrive make proactive, strategic decisions grounded in data.
Gathering the numbers is the first half. The second half is turning them into a feedback loop of experiments, lessons and adjustments.
Key Takeaways
- Adopt a Metrics-First Culture: Make metrics part of how your company works, with regular, intentional reviews and a habit of letting the numbers guide major decisions.
- Balance Growth Levers: Don't lean on acquisition alone. Investing in retention and expansion protects you against growth stalls and raises your revenue potential.
- Keep Testing: What works today may not work next quarter. Use your data to run a steady cycle of tests and improvements.
Treat your data as a working tool and you set your SaaS business up for compounding growth.
The right resources make it easier to act.
Here are the tools and templates we recommend for tracking your SaaS growth marketing metrics:
1. Analytics Tools to Simplify Your Workflow:
- Google Analytics: For website metrics like traffic, user behavior and conversion rates. Build custom reports to see your key funnel steps at a glance.
- Google Tag Manager: For sending signup, onboarding and conversion events to Google Analytics and your ad platforms. The dashboard's Events tab lists the tags and triggers to set up.
- Stripe / ProfitWell Metrics by Paddle: For revenue metrics like MRR, churn and refunds. Both give you subscription data you can copy into the dashboard each week.
- Mixpanel or Amplitude: For product engagement. They show how users move through the product and where they get stuck, which helps you choose your onboarding steps.
- HubSpot: For leads, lifecycle stages and sales performance, including demo requests, opportunities and closed deals.
2. Templates to Get You Started:
3. Setting Up Your Dashboard:
- Step 1: Pick the metrics most relevant to your stage and your sales motion, and delete the rest. Early-stage, product-led teams can start with Conversions and New Net MRR. Sales-led teams can start with Demos Booked and Demo Call Conversion Rate. To set targets for those numbers, the SaaS growth model template helps you work back from your revenue goal.
- Step 2: Label your funnel steps for your own process, and set up tracking for each one using the Events tab.
- Step 3: Schedule a weekly review. Bring in people from marketing, sales, product and customer success to get different views on the same numbers.
When choosing analytics tools, consider your company's size and resources. Early-stage startups are often better off with simple, low-cost tools like spreadsheets and Google Analytics.
As you grow, more advanced platforms with automation can save time and give you deeper insights.