Paid ads keep getting more expensive. The average Google Ads cost per click rose from $4.66 to $5.42 across the last three editions of LocaliQ's search advertising benchmarks. Fewer people click: when Google shows an AI summary, Pew found users clicked a regular result on 8% of visits, against 15% without one. And your conversion rate hasn't moved.
Meanwhile, the median B2B SaaS company takes 16 months to earn back what it spent to win a customer, according to the 2026 Aleph x Benchmarkit report. For an early-stage startup, that is a long wait with runway on the line.
Every new customer feels like it costs more than the last.
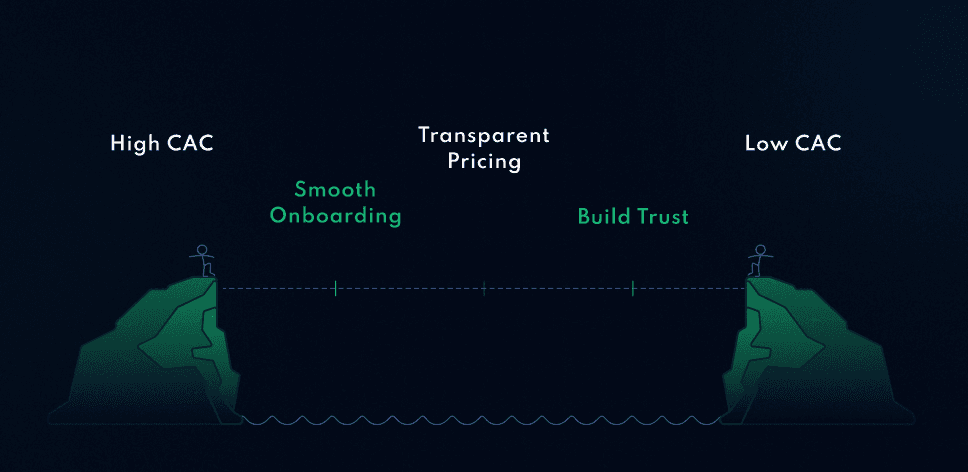
Learning how to lower customer acquisition costs has moved to the top of the list. It's the difference between growth and burn. The difference between testing new ideas and fighting to stay afloat.
Customer acquisition cost (CAC) in SaaS is what you spend to win one paying customer. Some of what drives it is out of your hands, because other companies are bidding for the same buyers. The rest sits in your own funnel. You lower it in three ways: pay less to reach the right buyers, convert more of them at each step, or spend less sales time per closed deal. You can't outspend the problem. You can find where it starts.
In this guide, we'll explain why CAC is rising, how to measure it, and how to find the stage of your funnel that's driving it up. Then we'll walk through the fixes for each stage, with examples from B2B SaaS teams.
Why Acquisition Keeps Getting More Expensive
Some of the pressure on your CAC comes from the channels themselves.
- Search. The average Google Ads cost per click rose from $4.66 to $5.26 to $5.42 across the last three editions of LocaliQ's search advertising benchmarks. The data covers all industries.
- Social. Meta's 2025 annual report shows its average price per ad up 10% in 2024 and 9% in 2025, across all advertisers.
- Organic search. In a Pew Research Center study of 900 US adults' browsing in 2025, people clicked a regular search result on 8% of visits when Google showed an AI summary and on 15% when it did not.
- Targeting. Apple's 2021 App Tracking Transparency change still limits how much ad platforms can track. Adjust puts the share of users who allow tracking at about 35% in mid-2025. A peer-reviewed study in Management Science of more than 4,200 ecommerce advertisers found the Meta ads most affected by the change lost 37% of their click-through rate, and the most Meta-dependent firms saw revenue fall 8% to 40% against less exposed firms. B2B buyers who research on desktop are less exposed, but the platforms' targeting and reporting got weaker for everyone.
- Sales. Theory Ventures' 2024 go-to-market survey found sales cycles about 13% longer on average, with payback periods stretching by a similar proportion.
None of these figures is specific to B2B SaaS, and you can do little about any of them. What you control is what happens after the click: who you pay to reach, how many of them convert, and how quickly deals close. The rest of this guide works on those.
Count the Full Cost Before You Cut Anything
A CAC number is only as useful as what goes into it. Two definitions from a16z's startup metrics guide are a good place to start:
- Blended CAC: total acquisition cost divided by all new customers, from every channel.
- Paid CAC: total acquisition cost divided by the new customers who came through paid marketing.
Blended CAC tells you whether the business can afford its growth. Paid CAC tells you whether your campaigns are working. a16z notes that blended CAC "doesn't inform how well your paid campaigns are working," which is why investors give the paid figure more weight.
The cost line should include:
- Ad spend and sponsorships
- Sales and marketing salaries and commissions
- Agency, contractor and freelancer fees
- Sales and marketing tools
- Free-tier and trial costs, if you run a product-led motion
- Your own selling time, if you still close deals yourself
That last item is where early CAC numbers most often go wrong. Greg Head of Practical Founders lists "We have zero CAC because we don't do paid ads" among the common CAC mistakes, and argues CAC should include "all the time the founder spent selling." Put a value on those hours. Otherwise CAC is likely to jump the day you hire someone to do the same work.
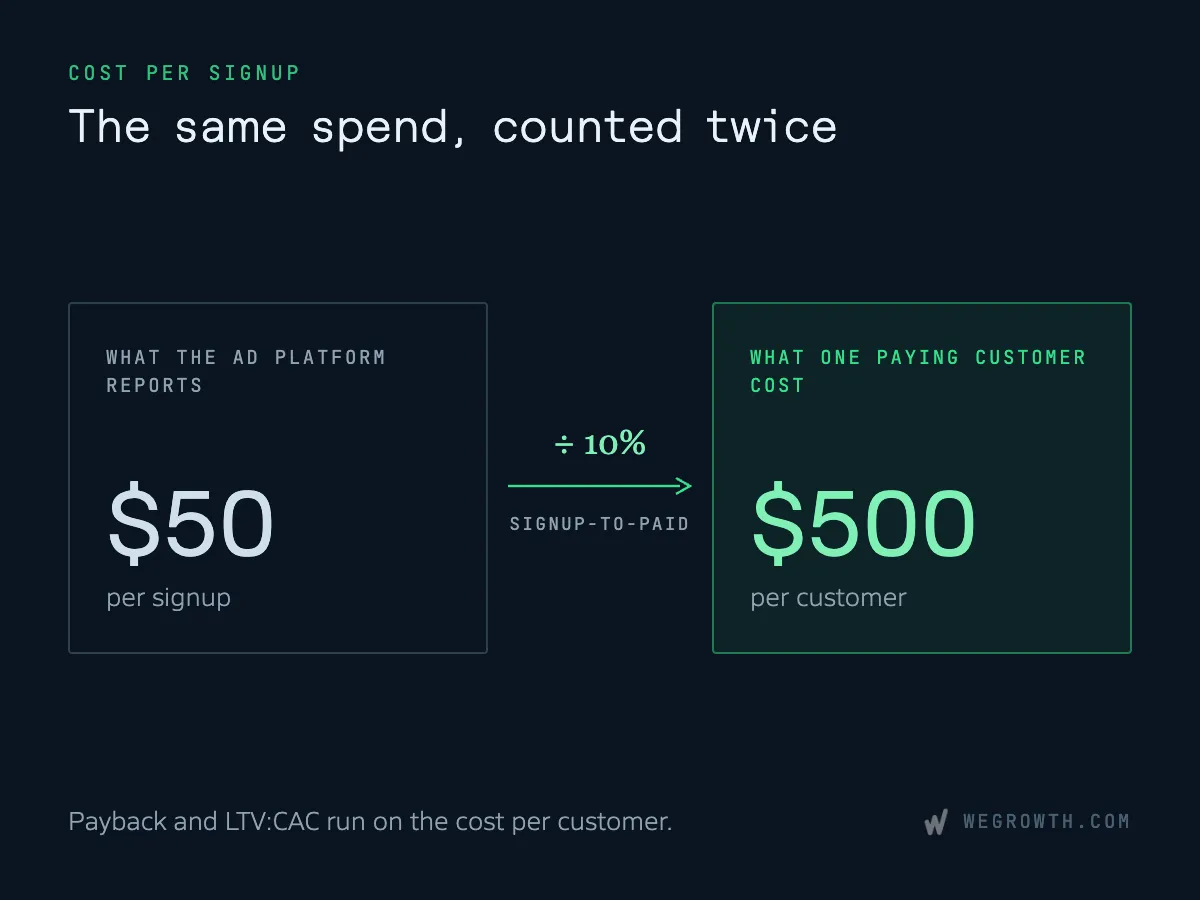
Be clear about which customer you are counting. Ad platforms report cost per lead or per signup, and many teams call that CAC. Our own homepage lists a client result as "Reduced Signup CAC from $220 to $60 via Meta Ads," and the label is the point: that is a cost per signup. Your cost per paying customer is the signup cost divided by your signup-to-paid rate. If one signup in ten pays, a $50 signup is a $500 customer.
At a few customers a month, CAC swings with every deal. Read it over a longer window, such as a rolling quarter. With a long sales cycle, compare each month's spend against the customers it produced later. Our SaaS growth marketing KPI dashboard template puts CAC, ROAS and conversion rates for your Facebook and Google campaigns in one view.
Check the tracking before you trust any of it. Duplicate conversion events inflate results, and conflicting UTMs and referral data blur which channel earned the customer. For the full calculation, see How to Calculate SaaS Unit Economics and our SaaS growth marketing metrics guide.
Judge the Number by Payback and Contract Size
A CAC figure on its own does not tell you whether it is too high. A $5,000 CAC is a problem for a $1,200-a-year product and comfortable for a $60,000 contract. Judge it by how fast you earn it back and how much the customer is worth.
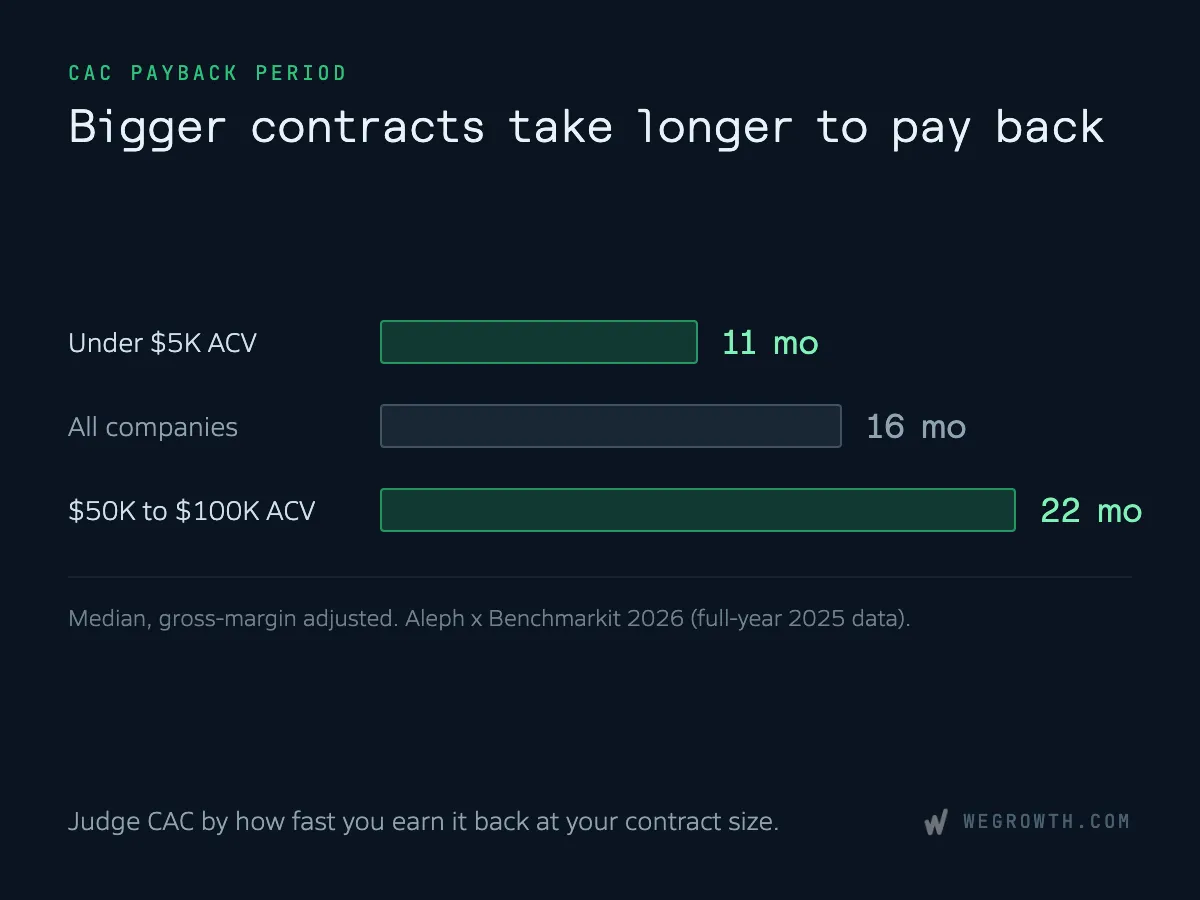
CAC payback is the number of months of gross-margin-adjusted revenue it takes to recover the cost of winning a customer. The 2026 Aleph x Benchmarkit report (full-year 2025 data, 198 companies for this metric) gives these medians:
- All companies: 16 months
- Under $5K annual contract value (ACV): 11 months
- $50K to $100K ACV: 22 months
- Horizontal SaaS: 14 months
- Vertical SaaS: 18 months
The same report puts median LTV:CAC at 5.6:1 for vertical SaaS and 4.1:1 for horizontal. Bessemer sets payback targets of under 12 months for SMB customers, under 18 for mid-market and under 24 for enterprise.
Treat these as context. Benchmark reports build CAC from total sales and marketing spend, and early-stage companies often book founder pay under general and administrative costs, so founder-led selling may be missing from the comparison. Dollar benchmarks for CAC per customer exist too, but the widely reused ones come from agency client data with no published sample size.
To see the highest CAC your pricing and churn can support at 3:1 LTV:CAC, run your numbers through the SaaS unit economics calculator.
Find the Stage Where Cost Jumps
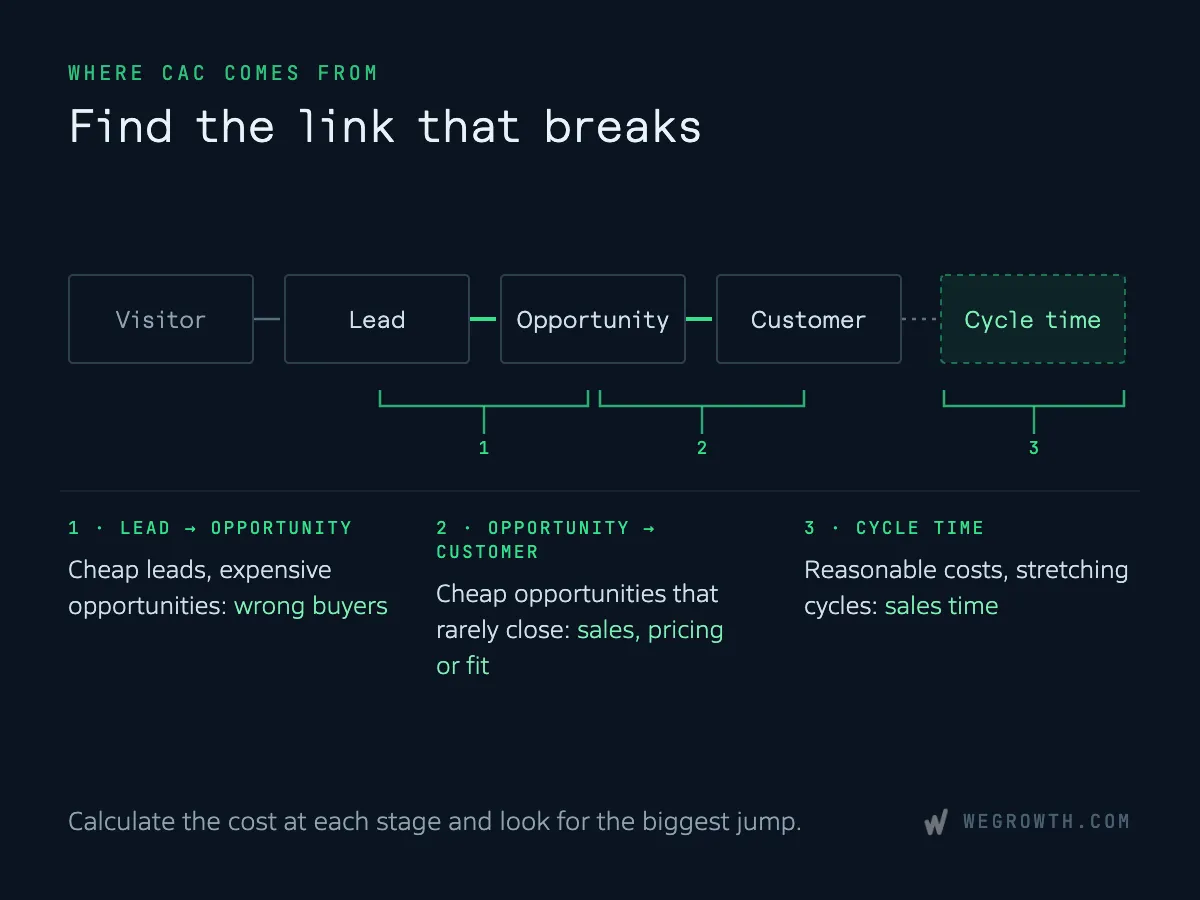
CAC is the result of a chain of numbers:
- What you pay per visitor or click
- The share of visitors who become leads or signups
- The share of leads who become qualified opportunities
- The share of opportunities that close
- How long that takes and how much sales time it uses
A change in any one of them moves CAC. That is why a list of tactics is hard to act on. Each tactic works on one link in the chain, and usually only one or two links are your problem.
Dave Kellogg makes the same point about payback. Quoted in The SaaS Barometer, he calls CAC payback "not an efficiency metric, but rather a risk metric," and adds that "the more a metric measures one thing, the easier it is to fix." Operators work on the inputs: win rate, stage conversion, cycle length and gross margin.
To find your weak link, calculate cost per lead, cost per qualified opportunity and cost per customer for each channel. Then look for the biggest jump between two neighboring stages.
- Cheap leads, expensive opportunities: you are reaching people who were never likely to buy.
- Cheap opportunities that rarely close: the problem sits in sales, pricing or fit.
- Reasonable costs at every stage, but cycles keep stretching: sales time is the cost driver.
Our unit economics template puts visitor, MQL, SQL and customer costs side by side for this comparison.
Expect your attribution software to miss part of the story. In a twelve-month study of its own pipeline, Refine Labs found its podcast credited with 53% of revenue when buyers said how they heard about the company, and with 0% in its attribution software. An open "How did you hear about us?" field on your signup or demo form, read alongside your analytics, gives you both views.
Lower the Cost of Reaching the Right Buyers
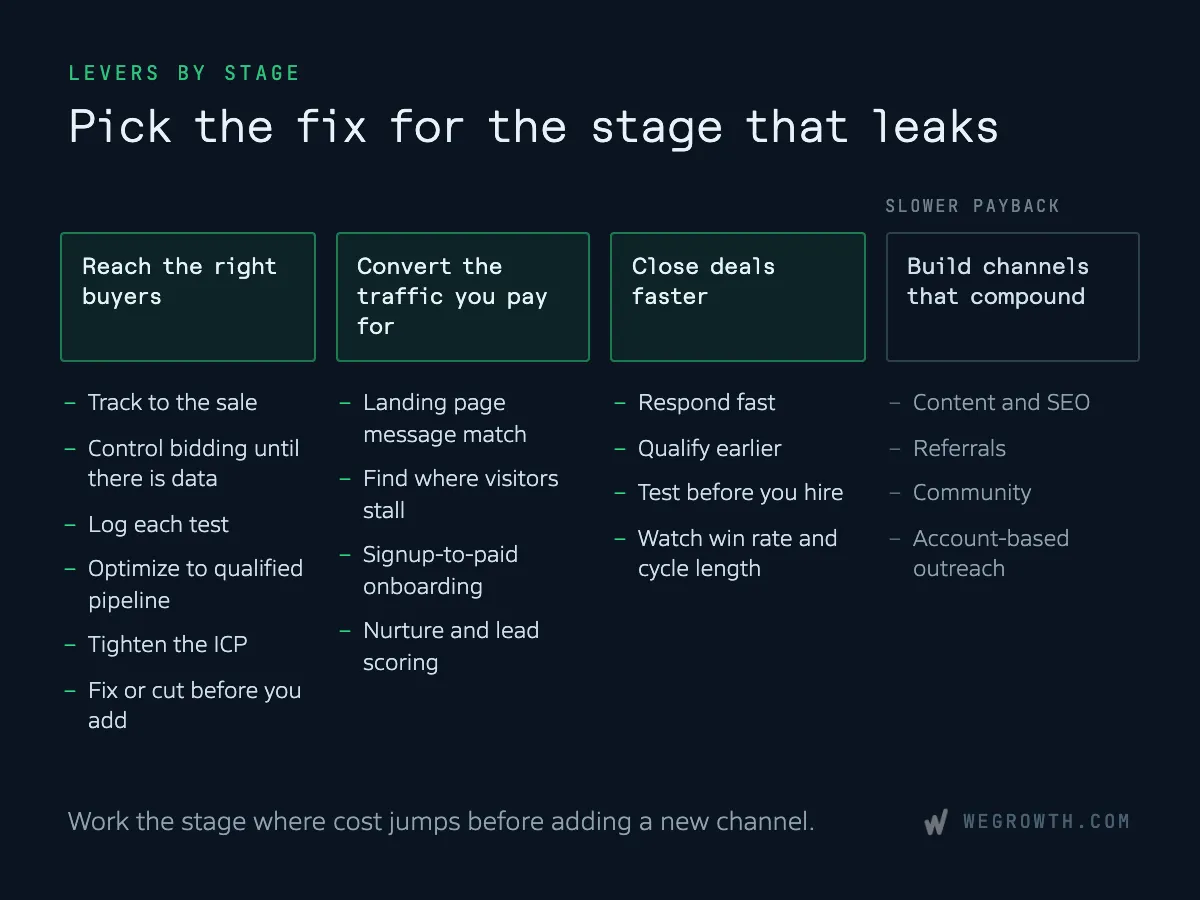
If cost jumps between lead and opportunity, you are paying to reach the wrong people. These fixes usually come first.
Track to the sale. Send qualified opportunities and closed deals back to your ad platforms, so their bidding learns from revenue.
Control bidding until there is data. Founders on Indie Hackers describe automated "maximize conversions" bidding with no conversion history spending budget on random clicks. Manual bids, tight match types, negative keywords and geographic limits keep a small budget on high-intent searches until the account has enough conversions to learn from.
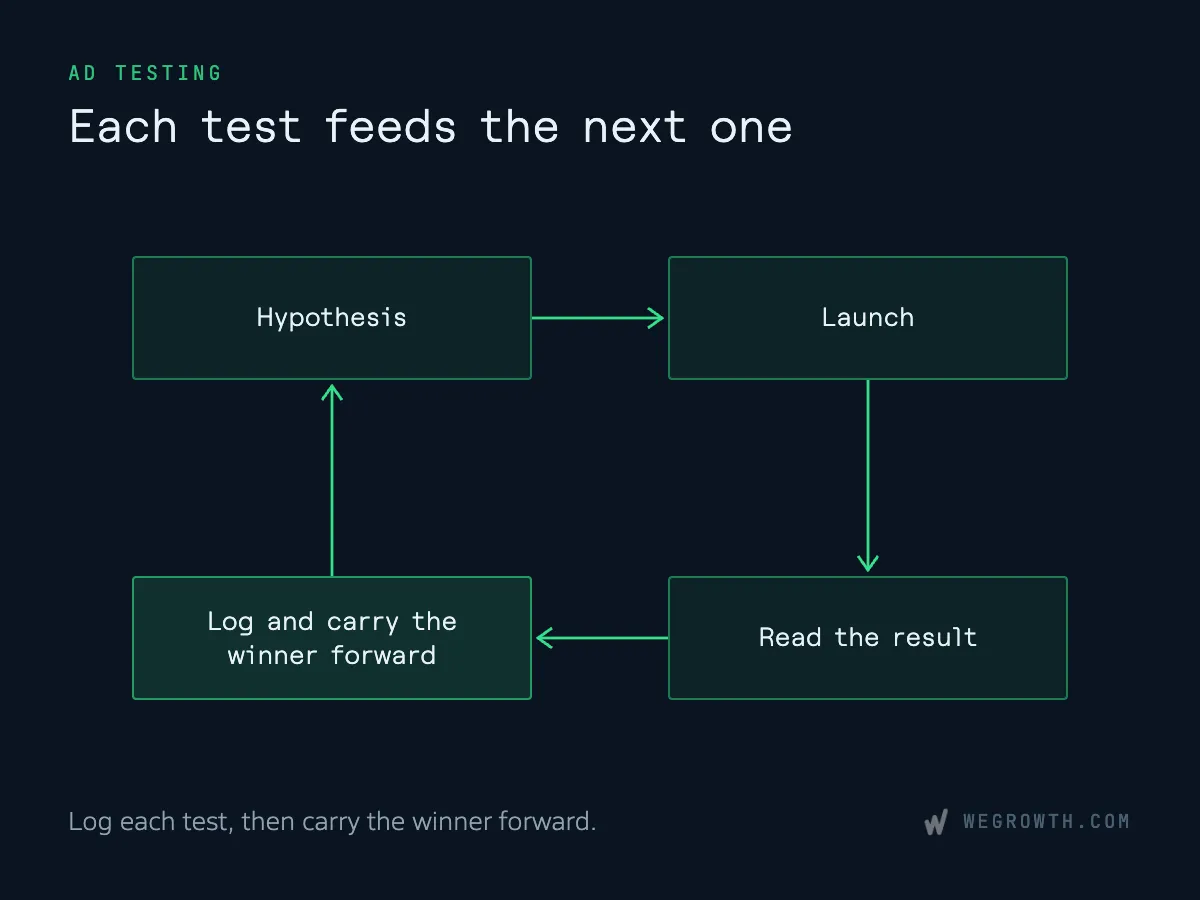
Log each test. Before a campaign goes live, write down the hypothesis, the owner and the target number, then record the result. That is the loop we run in client work, and the log keeps you from paying twice for a test you already lost.
Test the creative as well as the audience. Hooks, offers and headlines can each be tested against the others. Keep the ad's promise matched to the landing page, so a message that wins the click leads to a clear next step.
Optimize to qualified pipeline. For one vertical B2B SaaS client, "we separated qualified calls from lower-fit bookings in HubSpot, allowing us to optimize ad budgets purely on high-value pipeline." Bookings that never become opportunities make cost per lead look healthy while CAC climbs.
Tighten the ICP. Greg Head credits scalable CAC partly to "saying no to bad-fit customers." Fewer segments mean fewer audiences to fund and a sharper message for each. Start from the customers who stayed longest and paid the most. How to create a customer persona covers the research. Then group prospects by role, industry or region, and write the message for each group. The customer persona template gives each group a structure.
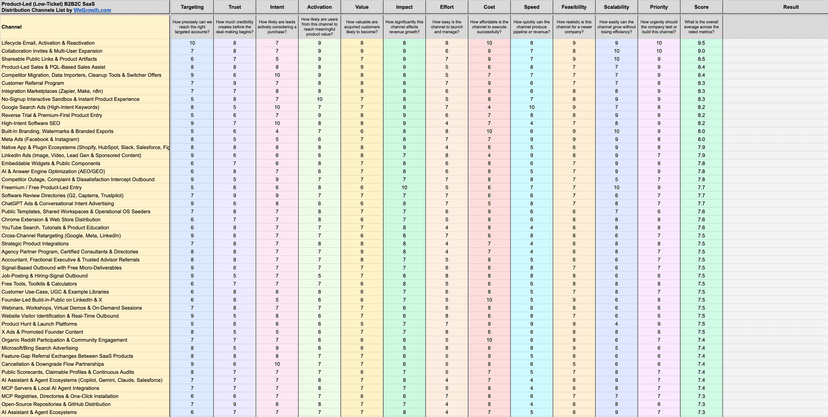
Fix or cut before you add. Once you can see cost per opportunity by channel, deal with the weakest one before launching another. A new channel adds spend and noise while the old leak keeps running. When you look for the next one, our acquisition channel finder ranks 150 channels for your stage and budget and compares them on cost per qualified lead and payback.
This is the work behind one of our results: we helped Vacation Tracker cut its Facebook CAC from $600 to $300 through stronger targeting, tracking and optimization. If paid acquisition is where your cost jumps, our SaaS PPC agency team works on exactly these fixes.
Convert More of the Traffic You Already Pay For
If visitors arrive but few sign up or book, each point of conversion you add lowers CAC with no extra spend. Our unit economics calculator puts it plainly: "Conversion rates are usually the cheapest lever."
Start with the page your paid traffic lands on. The ad, the headline and the form should make the same promise, and the ask should match how ready the visitor is. For Perspective, we designed landing pages that reached a 15% signup rate during paid acquisition campaigns. Our guide to improving landing page conversions covers diagnosis and fixes in detail.
To see where visitors stall, watch session recordings, heatmaps and scroll depth on that page. Then change one thing at a time, so you know which change moved the number. Past the landing page, our SaaS growth marketing services cover signup and onboarding flows and the steps from trial to paid.
For product-led companies, the next leak is signup to paid. A 2023 survey by Kyle Poyar and Lenny Rachitsky of more than 1,000 products, focused on B2B SaaS, puts good free-to-paid conversion at 3–5% for self-serve freemium and 8–12% for free trials, measured within six months. Well below those ranges, onboarding and time to first value are likely to matter more than traffic.
Be open about what users are signing up for. Show what the trial includes and when it ends, send a reminder before it ends, and let onboarding show the product's value before you ask for payment.
Count the full cost of a product-led motion when you compare it with sales-led. Poyar argues founders often leave R&D out of CAC. Benchmarkit's 2025 data found product-led growth "more expensive as measured by S&M to Revenue (%) over time," which the report calls "antithetical to popular belief."
Leads who are not ready to buy still cost money to acquire. Nurture recovers part of that spend:
- Lead magnets tied to a real pain point. A template, calculator or checklist lets early-stage buyers raise their hand before they want a call.
- Emails triggered by behavior. A pricing-page visit, a download or a stalled trial is a better cue than a fixed schedule.
- Lead scoring. Score on fit and activity, so sales time goes to the leads closest to buying.
- A clear handoff. Agree with sales on when a lead moves over and what happens next, including automatic follow-up for missed demos.
- Separate inbound and outbound CAC. The two motions rarely cost the same, and a blended figure hides which one needs work.
For nurture copy, Persona AI drafts a customer persona with goals, pain points and messaging from your website.
Shorten the Path From Opportunity to Signed Deal
If opportunities are plentiful but slow or unlikely to close, the cost driver is sales time.
Respond fast. In a 2011 Harvard Business Review study, firms that contacted online leads within an hour were nearly seven times as likely to qualify them as firms that waited even one hour longer.
Qualify earlier. Define the account, role and need that make a conversation worth having before it goes on the calendar. Sales time on poor-fit calls adds to CAC and never produces a customer.
Test before you hire. A sales hire can lower CAC or hide it, depending on how you set up the test. A founder on Hacker News describes the setup that produced a readable number: two SDRs focused only on outbound, measured on their results. One rep split between outbound and weak marketing leads never produced a clear CAC.
Watch win rate and cycle length. Ebsta and Pavilion's 2023 benchmark of 3.2 million opportunities, drawn from Ebsta's own customers, found win rates down 15% and sales cycles up 32% in 2022. Those are the two inputs that turn a healthy pipeline into an expensive one.
Build Channels That Get Cheaper as They Mature
Some levers cost more before they cost less. Set a payback horizon when you start them, so a slow start is not mistaken for failure.
Content and SEO. Search content keeps bringing visits after you stop paying for it, which is how it brings blended CAC down over time. The timeline is the catch. One founder on Hacker News reports a 3-month CAC payback from deep, distinctive content, while vendor estimates run to seven months or more. AI summaries also cut clicks on informational queries: Ahrefs measured a 58% lower click-through rate for the top result on keywords with an AI Overview. Start with high-intent pages, such as comparisons and use cases, which can support conversions soon after launch while broader SEO builds.
Referrals. A double-sided reward gives both the customer who refers and the company that signs up a reason to act. Referral platforms publish customer stories with large CAC reductions, mostly without baselines, so test it on your own numbers. Include the rewards in referral CAC; a16z lists referral fees and credits among the costs teams most often leave out. Promote the program inside the product and in customer emails, where your users already are. Then compare referral CAC with your paid channels and move budget if it holds up.
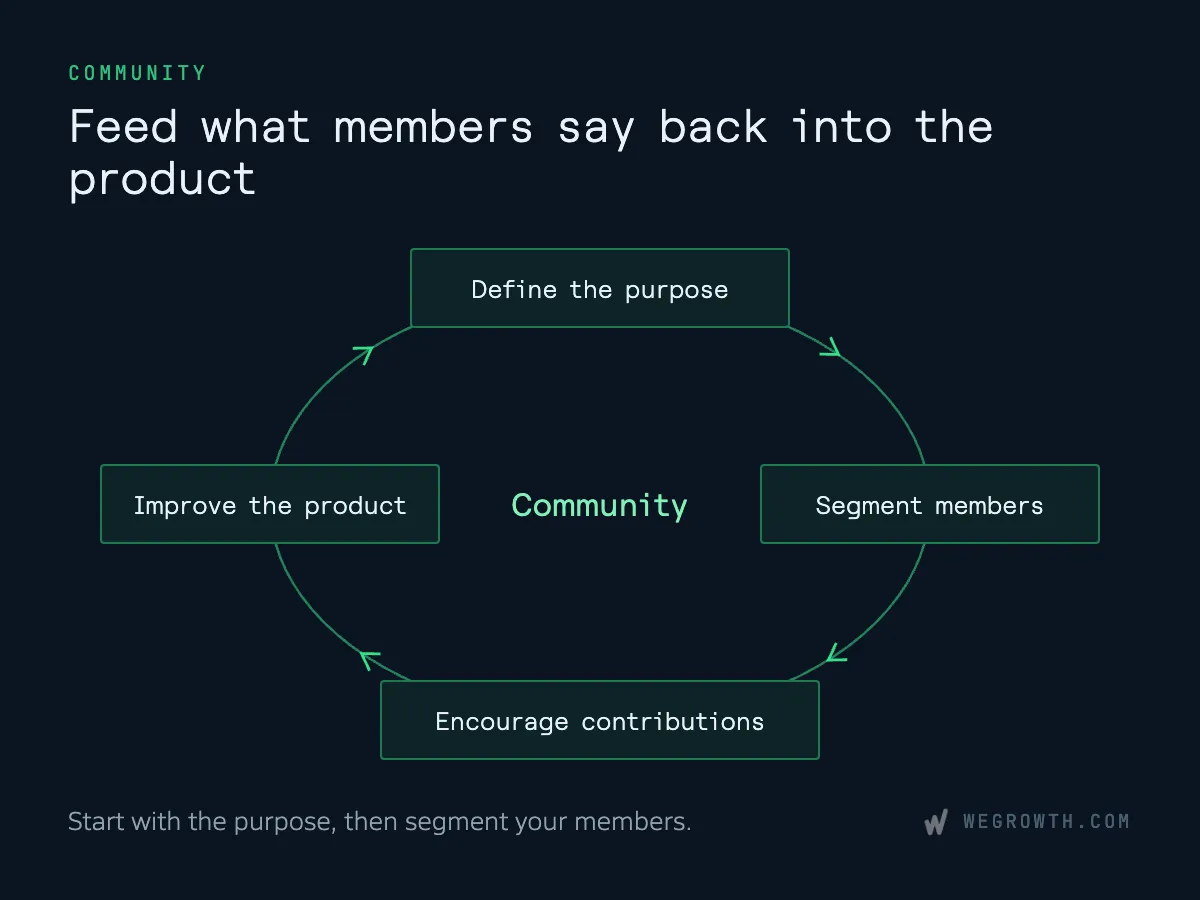
Community. Start with a purpose: why does the community exist, and who is it for? Segment members into ambassadors, new users and power users, and speak to each group differently. Offer small incentives such as early access or member-only content, and use what members say to improve the product. Practitioners who run B2B communities describe the payoff as faster sales conversations and better retention more often than new customers. If you count it toward acquisition, count its cost too.
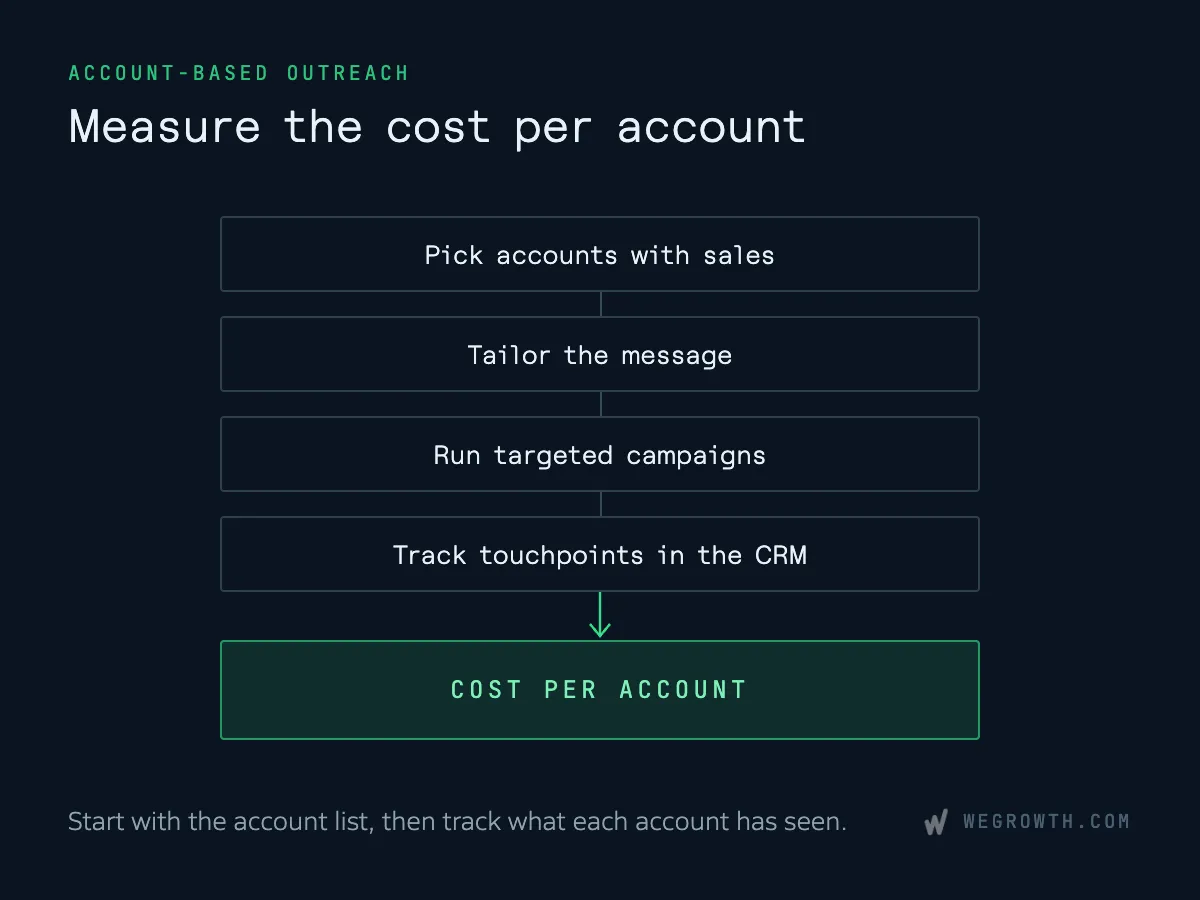
Account-based outreach. For higher-value deals, a short list of target accounts with tailored outreach can lower the cost per qualified account. Early on this can be manual: a researched list, personal email and LinkedIn messages, and retargeting for engaged accounts. Start with the account list: ask sales which accounts they most want to win. Sync every touchpoint to your CRM, so you can see what each account has already seen. Judge the program by cost per account, not cost per click. Dedicated ABM platforms can wait. Mezmo's CMO, Ajay Khanna, has said they can be overkill for a company still figuring out its ICP.
For a wider list of options, see our ranked list of customer acquisition channels.
When a Lower CAC Is the Wrong Target
Lowering CAC is a means. The goal is growth you can afford.
- Cutting spend lowers CAC on paper. If it also cuts the pipeline you need for your growth target, the business is worse off. The SaaS growth calculator shows the pipeline and spend your ARR target needs.
- A higher CAC can be the right one. Payback lengthens with contract size in the benchmarks above. Jason Lemkin's answer to the question of the right CAC is "the one you can afford."
- Early on, CAC may matter less than finding one channel that works. Lemkin argues CAC is "not even really a core metric" until later in a SaaS company's life. David Skok advises against calculating LTV:CAC before your go-to-market is repeatable. Track CAC from the start, and give it more weight as the motion settles.
- Retention improves the ratio and leaves CAC unchanged. Keeping customers longer raises LTV, which improves LTV:CAC and makes the same CAC more affordable. Expansion revenue also tends to cost less to win: Benchmarkit's 2025 report found a median $1.00 of spend per $1 of expansion ARR, against $2.00 per $1 of new-customer ARR.
A CAC Review Checklist
- The cost line includes salaries, tools, fees, trial costs and your own selling time.
- Blended CAC and paid CAC are calculated separately.
- Signups and paying customers are counted as different numbers.
- Tracking has been checked for duplicate conversions and broken UTMs.
- Each test is logged with a hypothesis, owner, target number and result.
- Inbound and outbound CAC are tracked separately.
- CAC is read over a rolling quarter, against the customers that spend produced.
- Payback is compared with benchmarks for your ACV.
- Cost per lead, per opportunity and per customer is calculated for each channel.
- The biggest jump between two stages has been identified.
- The weakest channel is fixed or cut before a new one is added.
- Slow levers have a payback horizon before they start.
Turn the Diagnosis Into a Plan
Lowering CAC comes down to the order you work in. Count it fully, judge it against payback, find the stage where cost jumps, and fix that stage before adding anything new.
If you want help putting that order into practice, our free B2B SaaS marketing plan sets out 90 days of strategies for customer acquisition, landing page conversion, onboarding and ad campaigns. Get your free marketing plan.