Jimmy Greaves, the all-time most prolific goalscorer in English football’s top division, once explained his scoring method like this: “What I had to do was get in the box 500 times a season. 100 times I’d connect. 50 times the goalkeeper would save it. Half of the rest would go in, and 25 goals a season would do me.”
That kind of thinking works just as well in the game of B2B SaaS: define your target annual and monthly recurring revenue (ARR and MRR), then work backward through the conversion rates to calculate the operational volume required to hit it.
But while Greaves could run his math on the back of a napkin, SaaS has too many interdependent variables: pipeline volume, win rates, contract values, gross margins, churn, acquisition spend, and more. To see how all those variables interact, you need growth modelling.
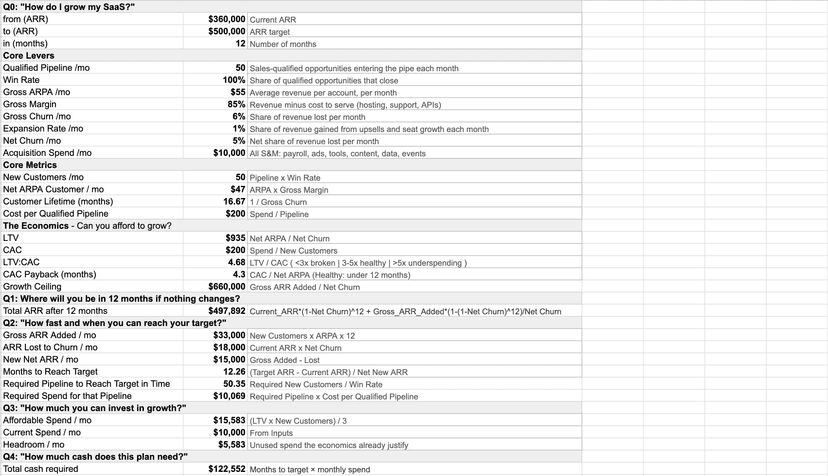
Our interactive SaaS Growth Model Template acts as a strategic growth diagnostic and simulation engine that connects where you are today to where you want to go, tests whether your unit economics can survive the journey, and provides an operational sandbox where you can play with the dials to discover the most realistic, achievable path to your goal.
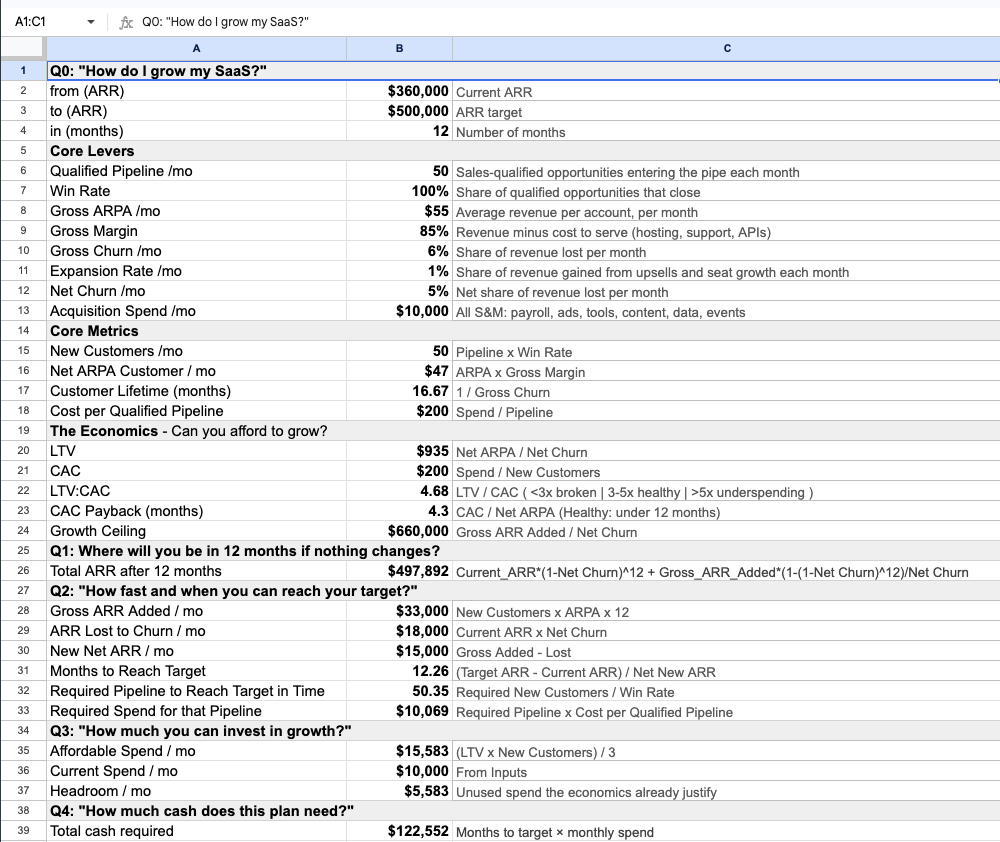
The Architecture: Reference Overview vs. The Operational Sandbox
To provide both structural clarity and practical utility, the WeGrowth growth modelling template is structured in two parts:
- Part I — The Reference Engine (The Architecture & Physics): The opening sheet presents a complete overview of the growth model using an illustrative worked example ($2M ARR growing toward $3M ARR). Its purpose is conceptual: it teaches the anatomy of the engine, the six foundational levers, the eight derived metrics, and the mathematical formulas (compounding cohort decay, unit economics, and growth ceilings) that connect them.
- Part II — The Operational Sandbox (Deploying the Tool): The subsequent tabs are pre-populated with this same example so you can see the formulas in action, but are designed for you to overwrite the yellow input cells with your own data. This is where you deploy the model: running target backsolves, evaluating budget headroom, and testing before-and-after scenarios by adjusting the operational dials.
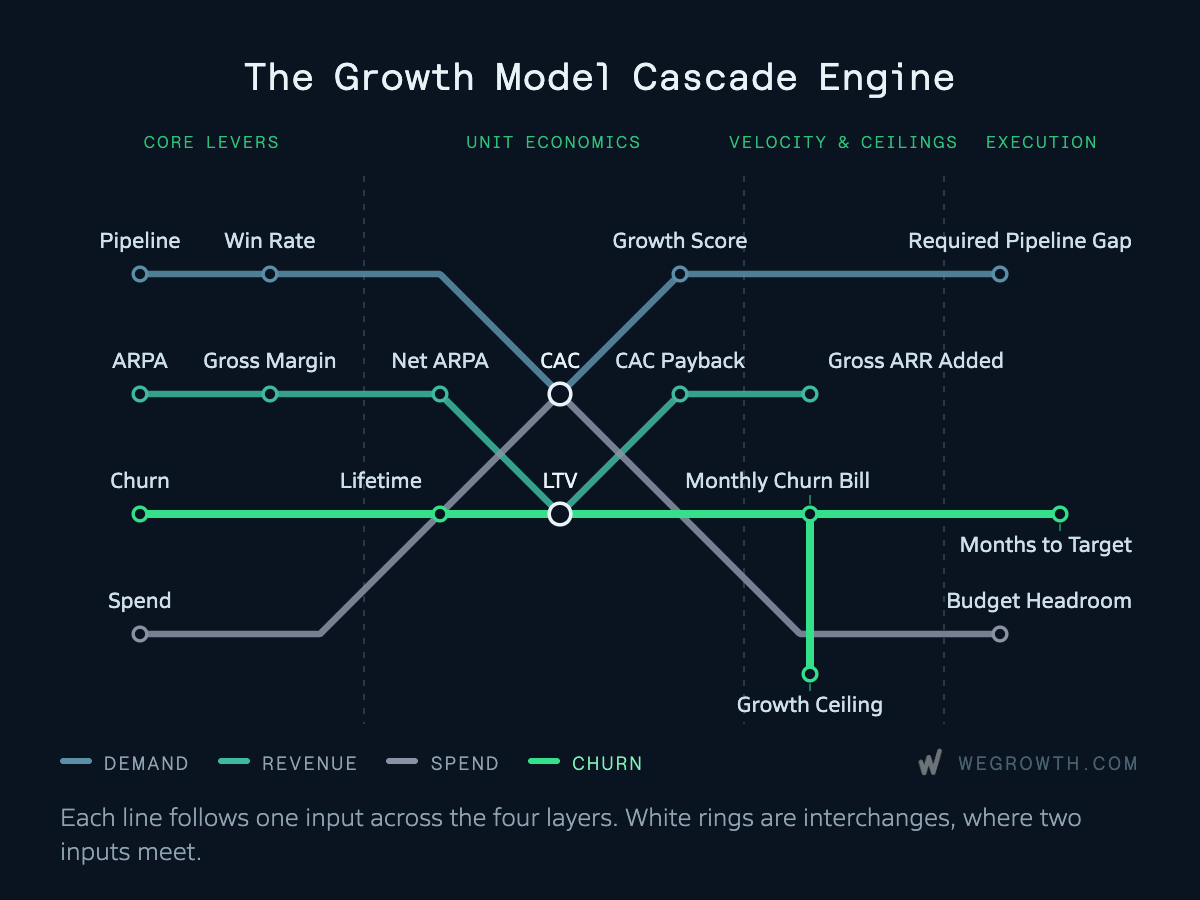
PART I: THE REFERENCE ENGINE ARCHITECTURE
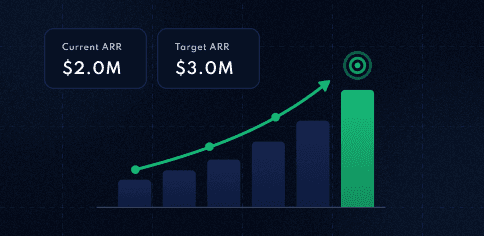
To see how the growth engine functions, the model's overview sheet maps out the complete system on a reference baseline: a SaaS company at $2,000,000 Current ARR targeting $3,000,000 Target ARR over a 12-month timeline.
The Anatomy of the Six Core Levers
Every calculation across the model is driven by six foundational operational inputs:
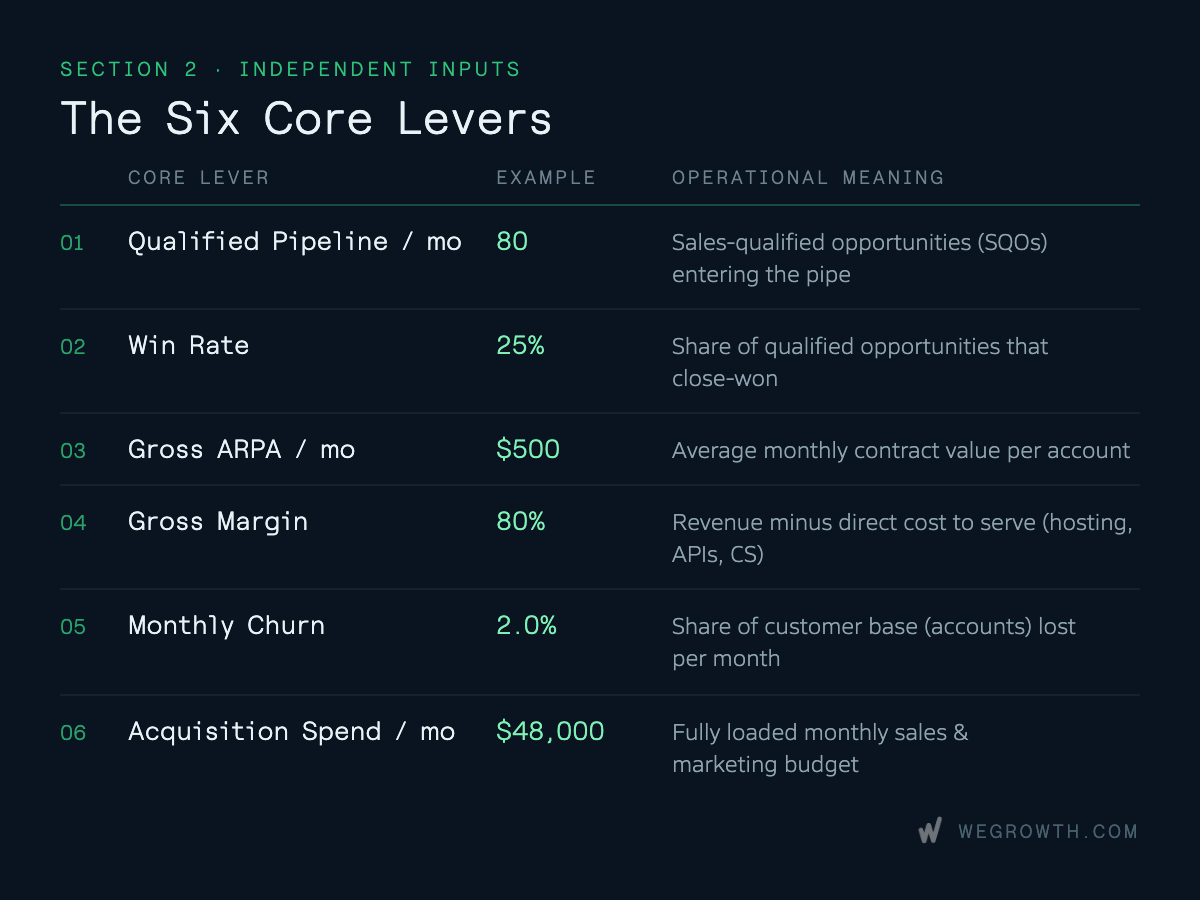
1. Qualified Pipeline per Month
The volume of sales-qualified opportunities (SQOs) entering the pipeline each month, averaged over a trailing 3- to 6-month window to smooth out volatility.
- The Qualification Standard: Count only opportunities that meet an explicit sales qualification standard—not raw website visitors, content downloads, or unqualified form fills.
- Sourcing Consistency: Whether pipeline originates from inbound search captured by B2B SaaS Google Ads agencies or cold pipeline generated by B2B SaaS outbound email agencies, the input must measure true qualified deal volume rather than top-of-funnel activity.
- Sales Cycle Lag: In longer sales cycles (e.g. 90 days), the pipeline generated this month represents the deals that close next quarter.
2. Win Rate
The historical ratio of closed-won deals to total qualified opportunities over the same trailing period.
- Empirical Close Rates vs. Subjective Estimates: In many CRMs, sales reps assign subjective percentages to open deals based on their pipeline stage (e.g. "Stage 3 = 50% probability"). The model avoids these subjective estimates and strictly uses your actual historical close rate: total closed-won deals divided by total qualified opportunities that entered the pipeline.
3. Gross ARPA per Month
The average monthly revenue per account across the active customer base.
- Annual upfront contracts are divided by 12 to normalize all revenue lines to a monthly run-rate.
- In businesses with multiple tiers, this is the blended average monthly subscription fee weighted across all active accounts.
4. Gross Margin
Gross margin is the percentage of top-line revenue retained after deducting direct Cost of Goods Sold (COGS), or the Cost to Serve.
- What Belongs in SaaS COGS: Cloud infrastructure and compute (AWS, GCP), third-party paid APIs (OpenAI tokens, Twilio, SendGrid), payment gateway transaction fees (Stripe 2.9%), and dedicated customer support and onboarding staff.
- The Golden Rule Test for COGS: "If active customer volume doubled tomorrow, does this expense increase directly to keep the product running?" If yes, it is COGS. (General software engineering/R&D, executive payroll, and marketing ad campaigns are Operating Expenses / OpEx, not COGS).
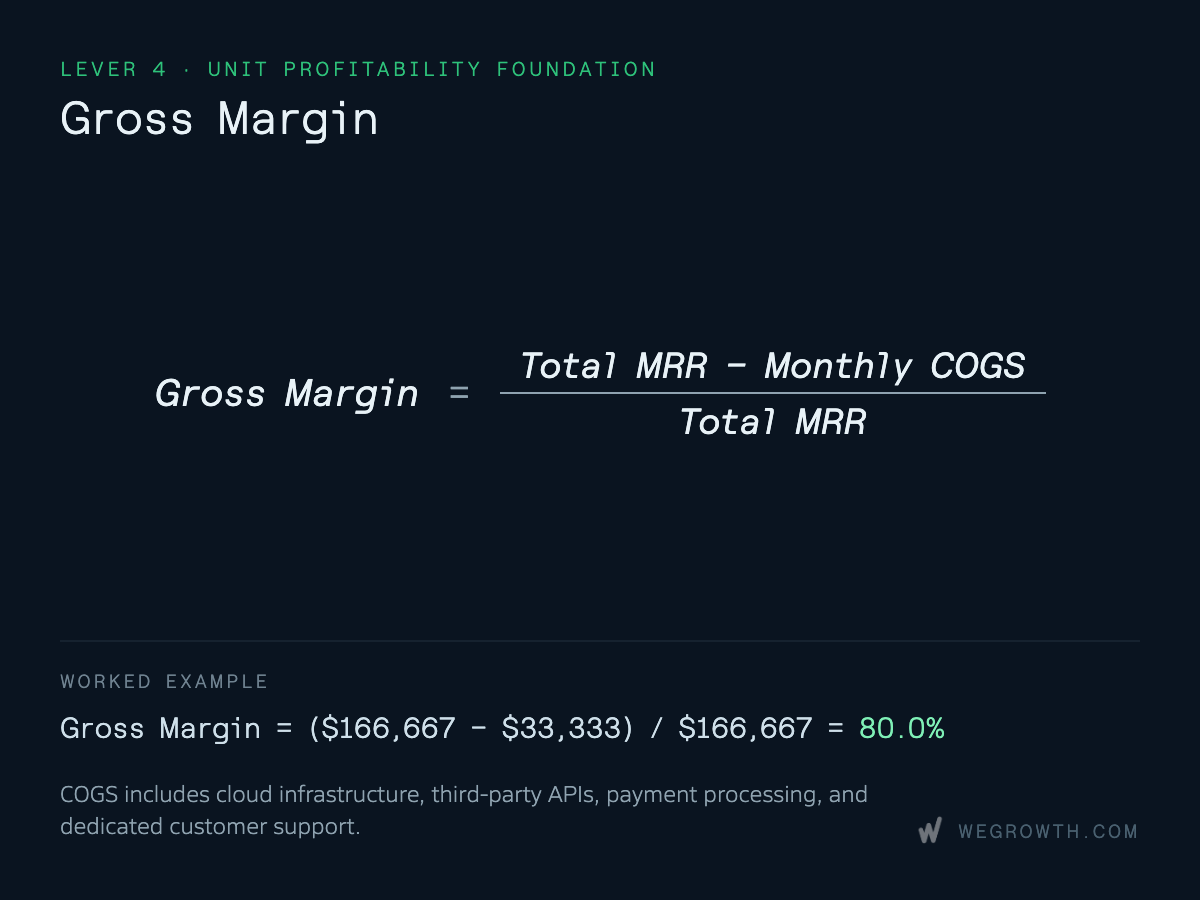
- Derivation: Gross margin is calculated by deducting direct monthly COGS from total MRR, divided by total MRR:
A note on Planning Horizon & Non-Linear Cost Caveat: The model uses a fixed Gross Margin percentage as an aggregate proxy for a 12-month planning window. In reality, delivery costs do not scale strictly linearly: infrastructure has fixed baselines that dilute over time, customer support staff is hired in discrete step-functions, and usage-based API costs can fluctuate. For this reason, the model is designed for a 12-month operational planning horizon and should be recalibrated annually rather than projected blindly 3 to 5 years into the future.
5. Monthly Churn
The percentage of active paying customer accounts that cancel each month (Lost Accounts ÷ Starting Accounts).
- Account-level churn is required here because average customer lifetime is derived directly from the monthly churn rate:
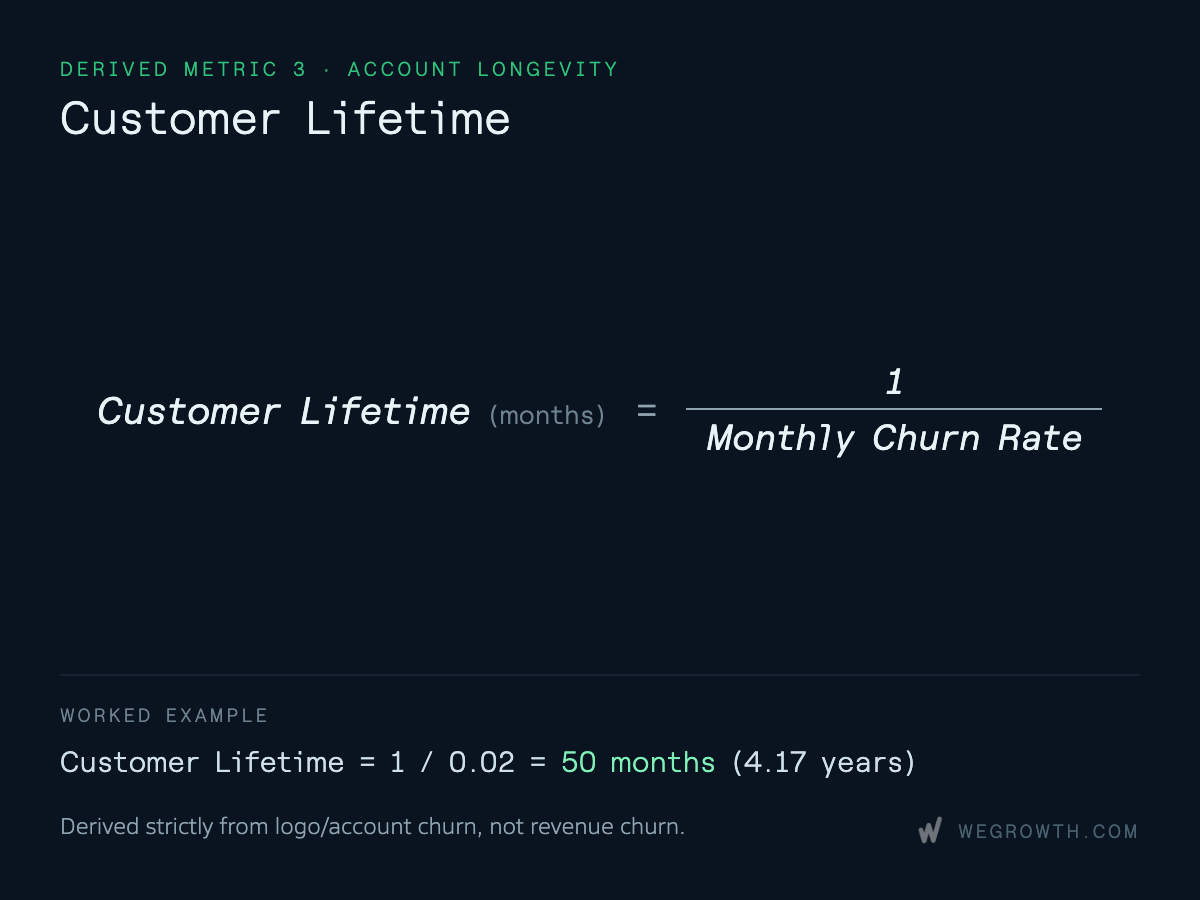
- Note on Net Revenue Retention (NRR): While NRR is a vital executive metric for expansion, calculating account lifetime and customer-level LTV requires logo/account churn.
6. Acquisition Spend per Month
The fully loaded monthly budget spent to acquire new customers: paid advertising (Google, LinkedIn, Meta), sales and marketing team payroll, outbound prospecting tools, data enrichment, content production, events, and agency retainer fees.
Fully loaded payroll ensures the model's unit economics remain honest. Sales rep ramp time should be priced in, because the salary of a ramping rep sits in the spend that produced this month's pipeline.
The Eight Derived Core Metrics
From those six foundational levers, the model computes eight essential unit economic and capital efficiency metrics (for a comprehensive breakdown of benchmarks and formula dynamics, read our deep dive on SaaS unit economics):
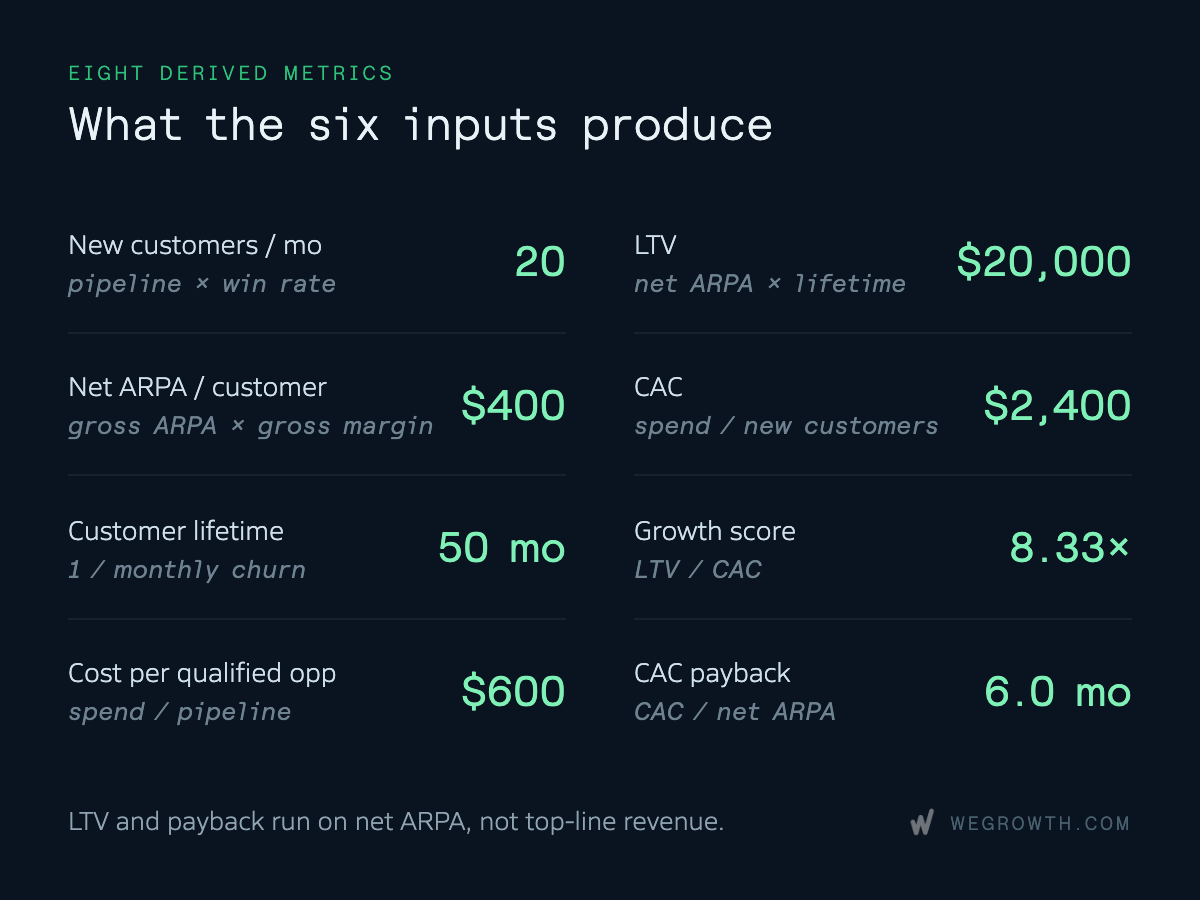
Top-Line Gross ARPA vs. Net ARPA
The model maintains a strict mathematical separation between top-line contracted revenue and net unit profit:
- Top-Line Metrics (Gross ARPA): Used strictly for contracted revenue volume, MRR, and ARR.
- Profitability & Payback (Net ARPA): Used strictly for LTV and CAC Payback. You cannot pay marketing acquisition bills with gross revenue that belongs to AWS or Stripe; CAC must be recouped from Net ARPA (revenue remaining after direct delivery costs).
Growth Score (LTV:CAC) as a "License to Spend"
The Growth Score evaluates whether the customer acquisition engine is economically healthy enough to scale:
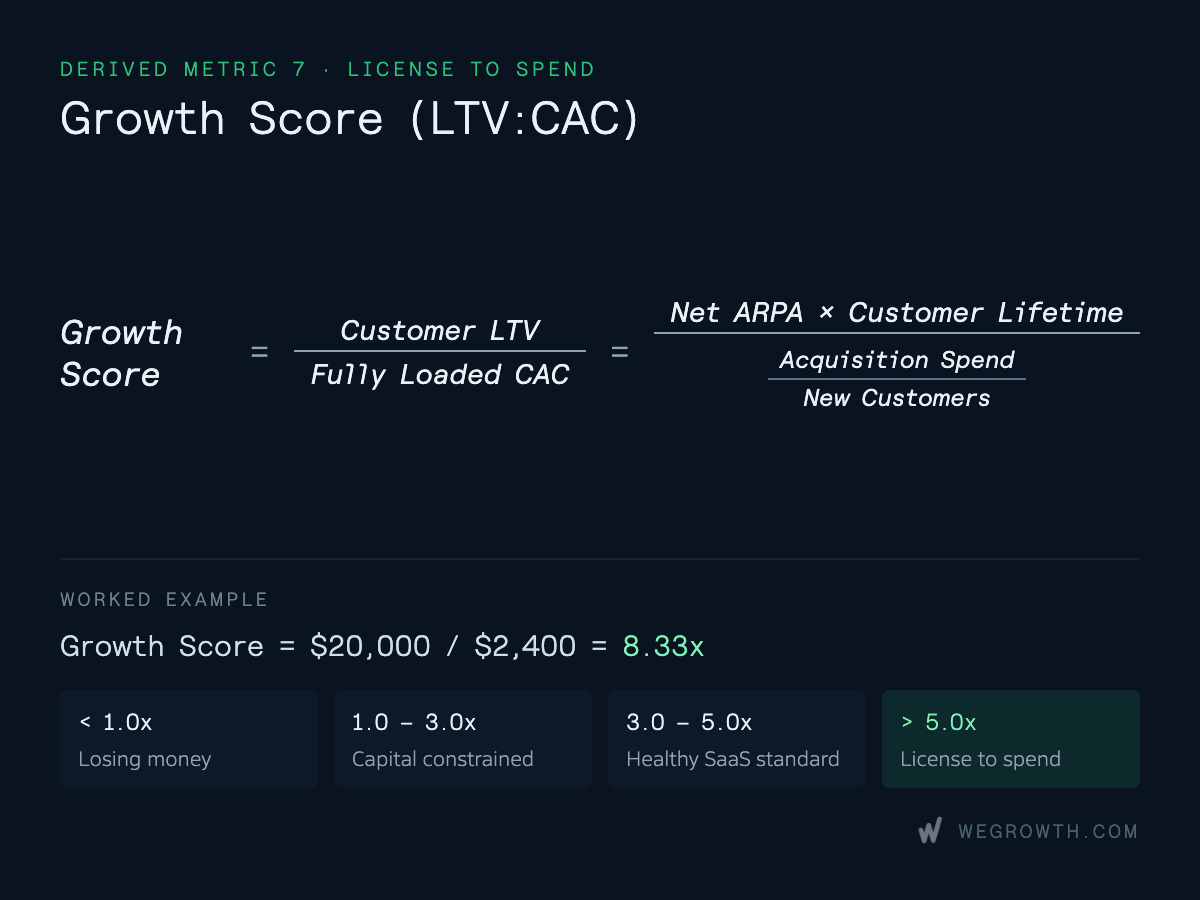
- Under 1.0x: Losing money on every customer acquired. Stop all scaling immediately.
- 1.0x – 3.0x: Unprofitable or high-risk growth. Unit economics cannot support aggressive paid acquisition.
- 3.0x – 5.0x: Healthy, sustainable B2B SaaS standard.
- 5.0x – 8.0x: Highly profitable machine with significant room to accelerate investment.
- Above 8.0x: Underinvesting in growth.
In the reference example, a Growth Score of 8.33x indicates that the business is underinvesting. The unit economics are proven and highly profitable; the company is simply purchasing too few qualified opportunities relative to its capacity.
CAC Payback as a Working Capital Engine
CAC Payback is fundamentally a cash flow and liquidity metric:
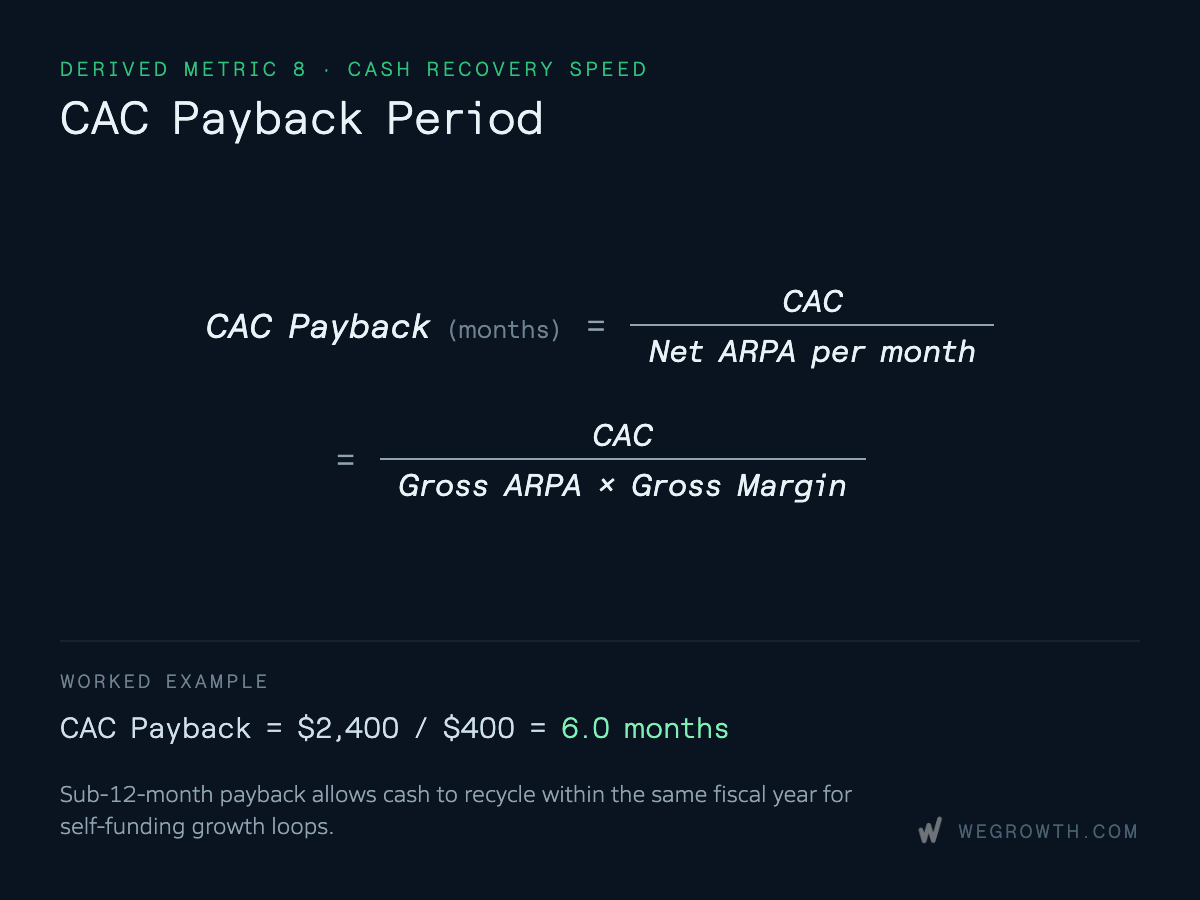
Why is under 12 months the gold standard in SaaS?
- The Self-Funding Cash Recycling Loop: Recouping CAC within 6 to 12 months means cash collected from a customer can be reinvested to acquire the next customer within the same fiscal year, creating an organic compounding loop without requiring external equity or debt.
- Preventing "Growing into Bankruptcy": If a company scales aggressively with an 18–24 month payback, every new customer creates a massive multi-year cash deficit. Fast-growing companies can run out of cash and become insolvent even while top-line ARR looks impressive.
- The Lifetime Margin of Safety: When payback is a fraction of customer lifetime, the business enjoys years of pure gross profit from every acquired account.
The Compounding ARR Engine (Baseline Trajectory)
To project where a business will land over a 12-month horizon, the model computes the Autopilot Baseline: the deterministic outcome if all six baseline levers hold steady with zero operational drift.
The "Naive Math" Trap
A naive linear forecast simply adds up net monthly additions:
The Naive Linear Projection: Naive ARR = Current ARR + 12 × (Monthly Gross ARR Added - Monthly Churn Loss) Naive ARR = $2,000,000 + 12 × ($120,000 - $40,000) = $2,960,000
This naive linear projection is wrong by over $103,000 because:
- It assumes the starting $2M base stays static, when in reality 2% monthly compounding churn shrinks it to $1,568,740.
- It assumes newly acquired customers never churn during the year.
How the Compounding Math Works: A Step-by-Step Walkthrough
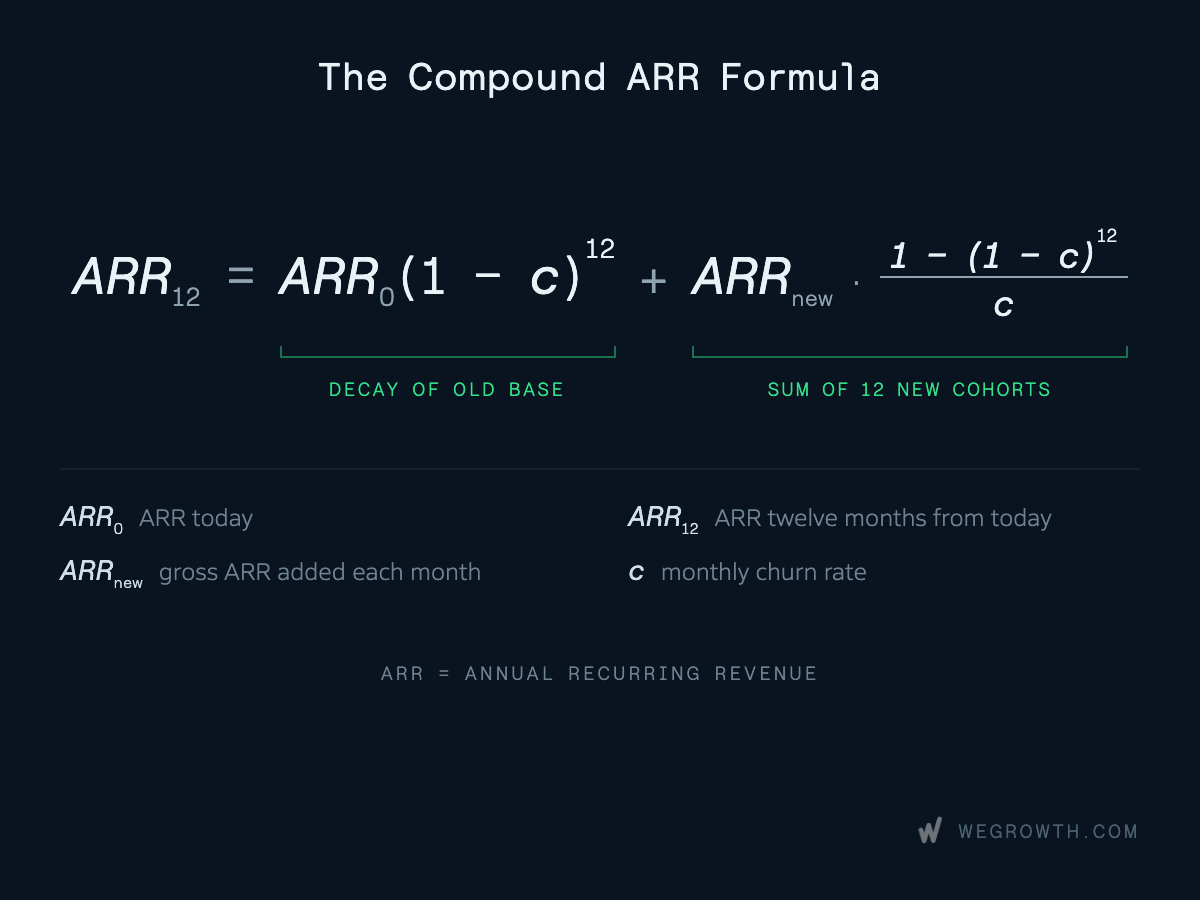
The model evaluates revenue as two separate engines running simultaneously:
Engine 1: What happens to the starting customer base?
Starting with $2,000,000 in ARR, losing 2% each month means 98% of the remaining base stays (1 - 0.02 = 0.98).
- After 1 month: $2,000,000 × 0.98
- After 2 months: $2,000,000 × 0.98 × 0.98
- After 12 months: Multiplying by 0.98 twelve times:
Even with a strong 2% monthly churn rate, the starting base naturally shrinks to ~$1.57M by the end of the year.
Engine 2: What happens to the new monthly cohorts?
Every month, 20 new customers add $120,000 in new annualized ARR (20 × $500 × 12).
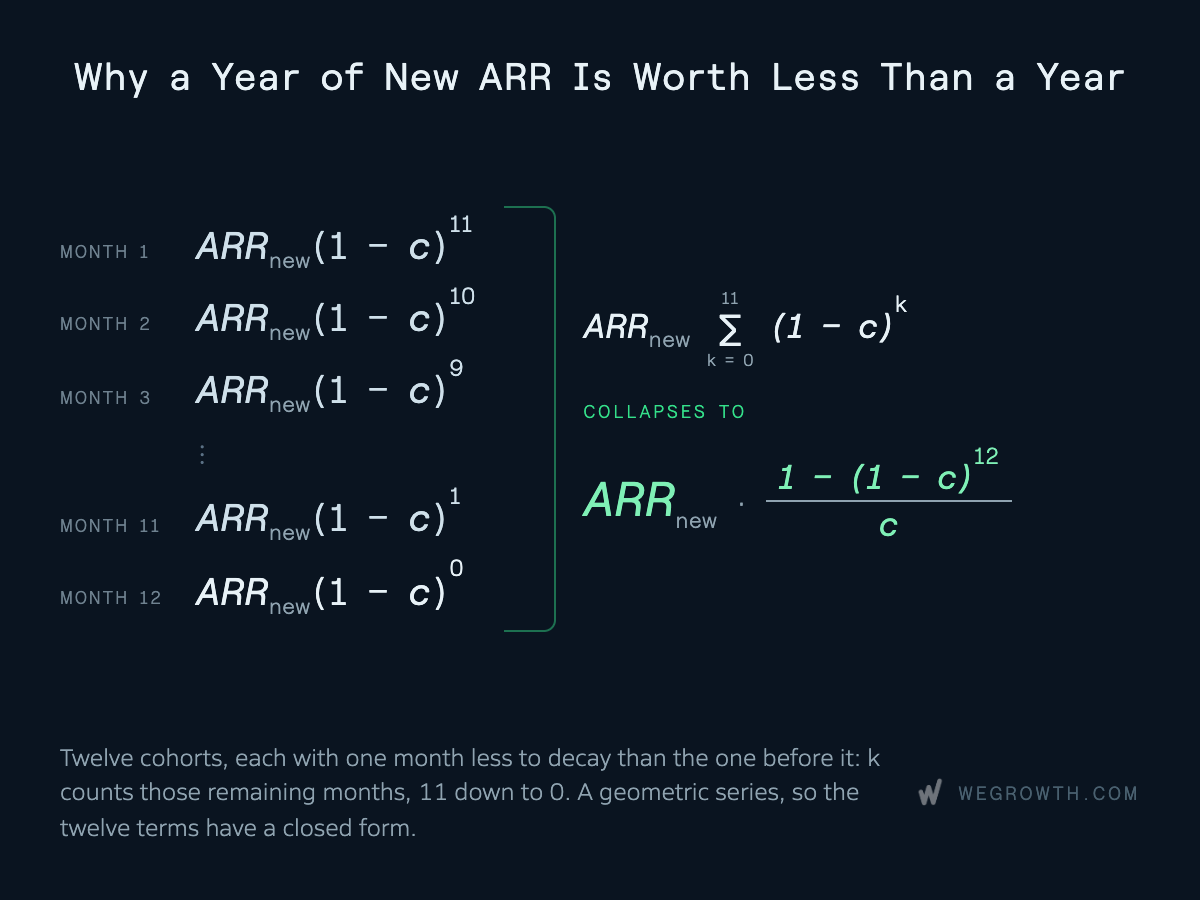
Because these 12 batches join at different times throughout the year, they experience different amounts of churn by Month 12:
- Month 12 cohort (joined in the last month): 0 months of churn → 100% remains (1.00)
- Month 11 cohort (joined 1 month ago): Churned once → 98% remains (0.98)
- Month 10 cohort (joined 2 months ago): Churned twice → 96% remains (0.98^2)
- ...
- Month 1 cohort (joined in the first month): Churned 11 times → 80% remains (0.98^11)
The algebraic fraction (1 - (1 - Monthly Churn)^12) / Monthly Churn is the mathematical shortcut that sums those 12 shrinking batches in a single operation:
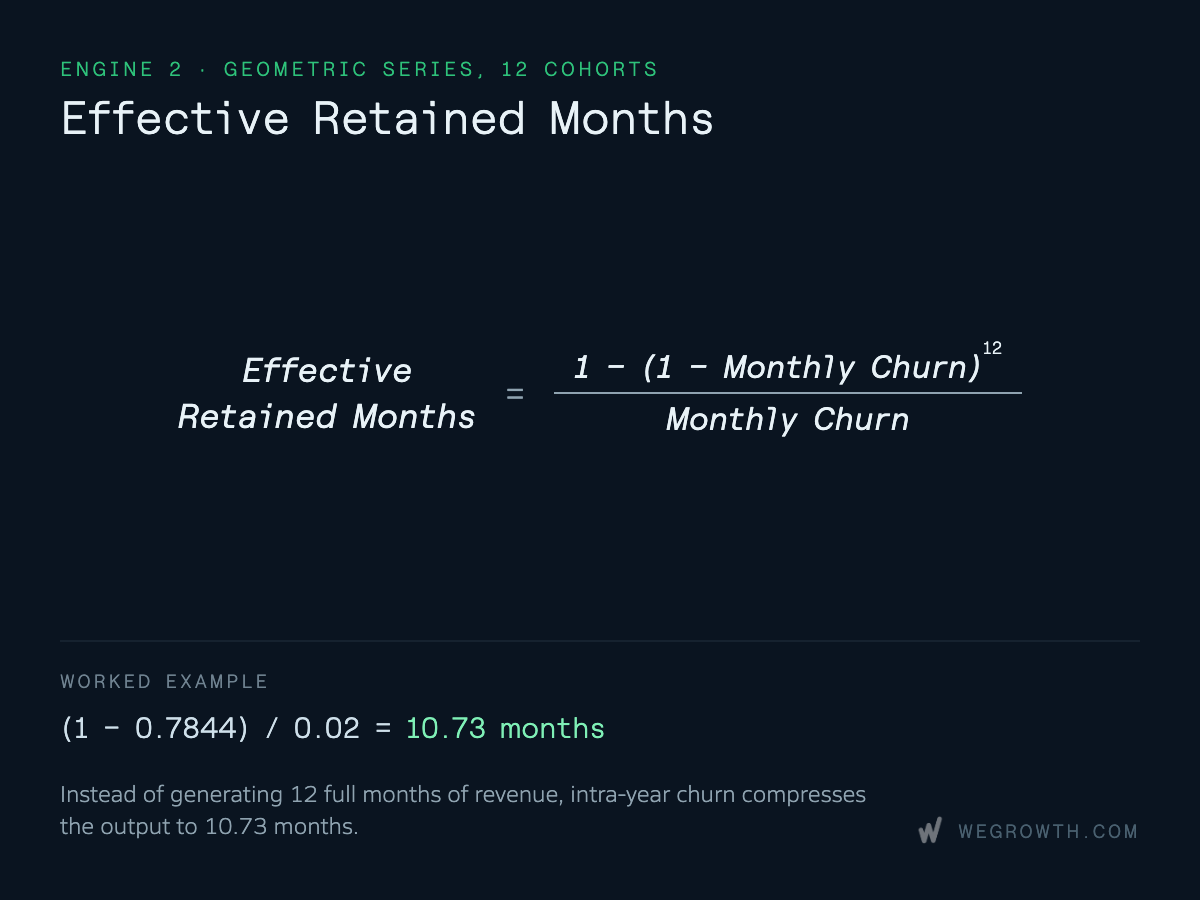
Instead of yielding 12 full months of new revenue, churn reduces the annual output to 10.73 Effective Retained Months.
The Final 12-Month Baseline Total:
Total Projected ARR (Month 12): Surviving Old Base: $1,568,740
- Surviving New Cohorts: $1,287,558 ─────────────────────────────────────────── Total Projected ARR (Month 12) = $2,856,298
The Master Compounding ARR Formula: Total ARR (Month 12) = [ Current ARR × (1 - Churn)^12 ] + [ Gross ARR Added / mo × (1 - (1 - Churn)^12) / Churn ]
Holding baseline levers steady lands the reference company at $2.856M ARR in 12 months—revealing a $143,702 ARR gap against the $3.0M target.
The Growth Ceiling (Terminal Velocity)
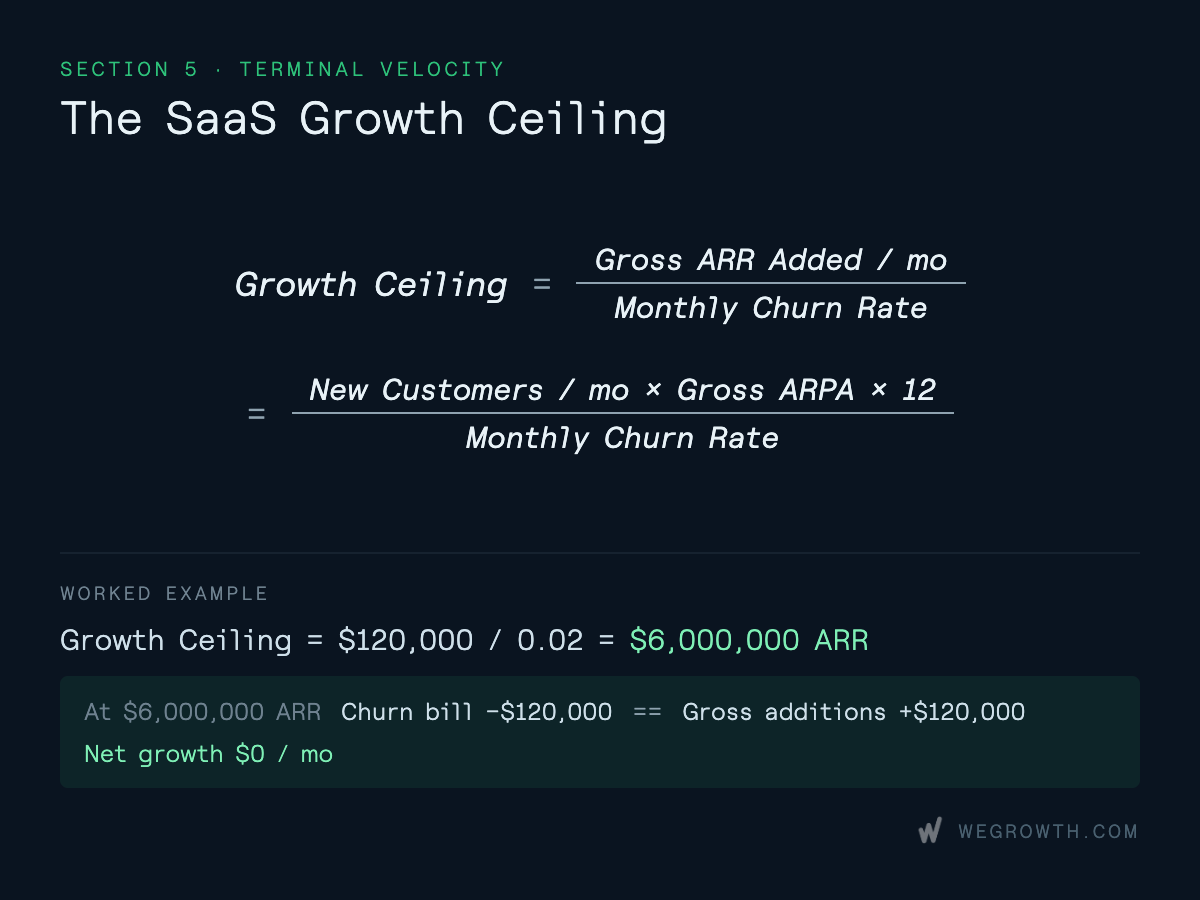
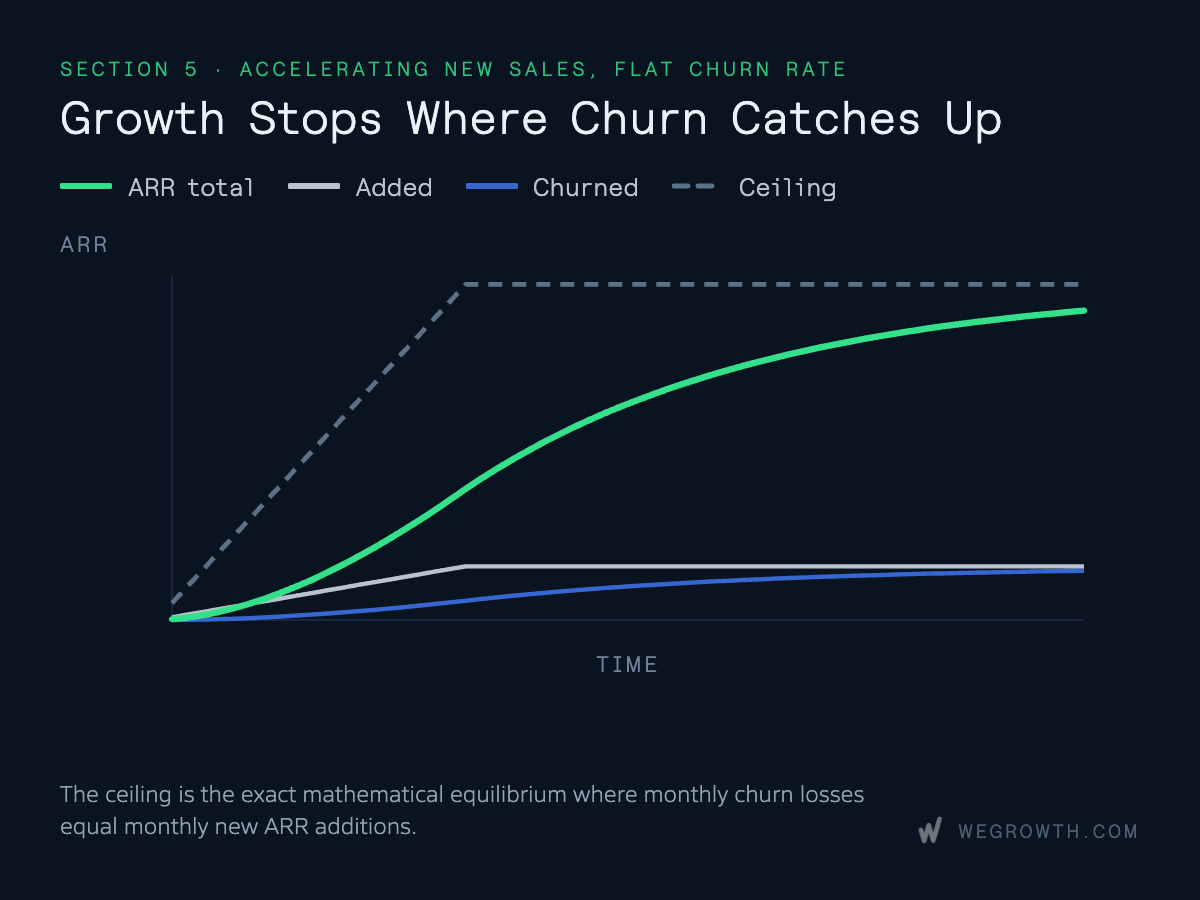
Every SaaS business has a mathematical limit called the Growth Ceiling, which defines the maximum ARR the company can ever reach at its current acquisition pace and churn rate.
Why the Ceiling Exists
- New sales add a FIXED dollar amount: +$120,000/month in ARR.
- Churn drains a PERCENTAGE of total ARR: 2% × Current ARR.
As ARR scales, the 2% monthly churn bill increases in absolute dollars. When the company reaches $6,000,000 ARR, the monthly churn bill reaches $120,000/mo ($6,000,000 × 0.02). At that point, churn exactly equals new sales, and net revenue growth stops entirely.
Lessons:
- Target Positioning: If a target is below the ceiling ($3M target vs. $6M ceiling), reaching it is purely an operational question of time and pipeline volume. If a target sits above the ceiling, no amount of time or ad spend can reach it without improving retention or ARPA.
- Moving the Ceiling: To lift the ceiling, a company must either increase gross additions (more pipeline, higher win rate, higher ARPA) or reduce churn. Cutting churn from 2% to 1.5% immediately expands this company's ceiling from $6M to $8M ARR on identical sales performance.
PART II: DEPLOYING THE MODEL (THE OPERATIONAL SANDBOX)
The subsequent sheets in the workbook are where you deploy the model for your own business. When you open the workbook, the sheets are pre-populated with the reference example above so you can see how all the formulas connect. To use the model, simply overwrite the yellow input cells with your company's own numbers.
Target Backsolving ("What Has to Be True?")
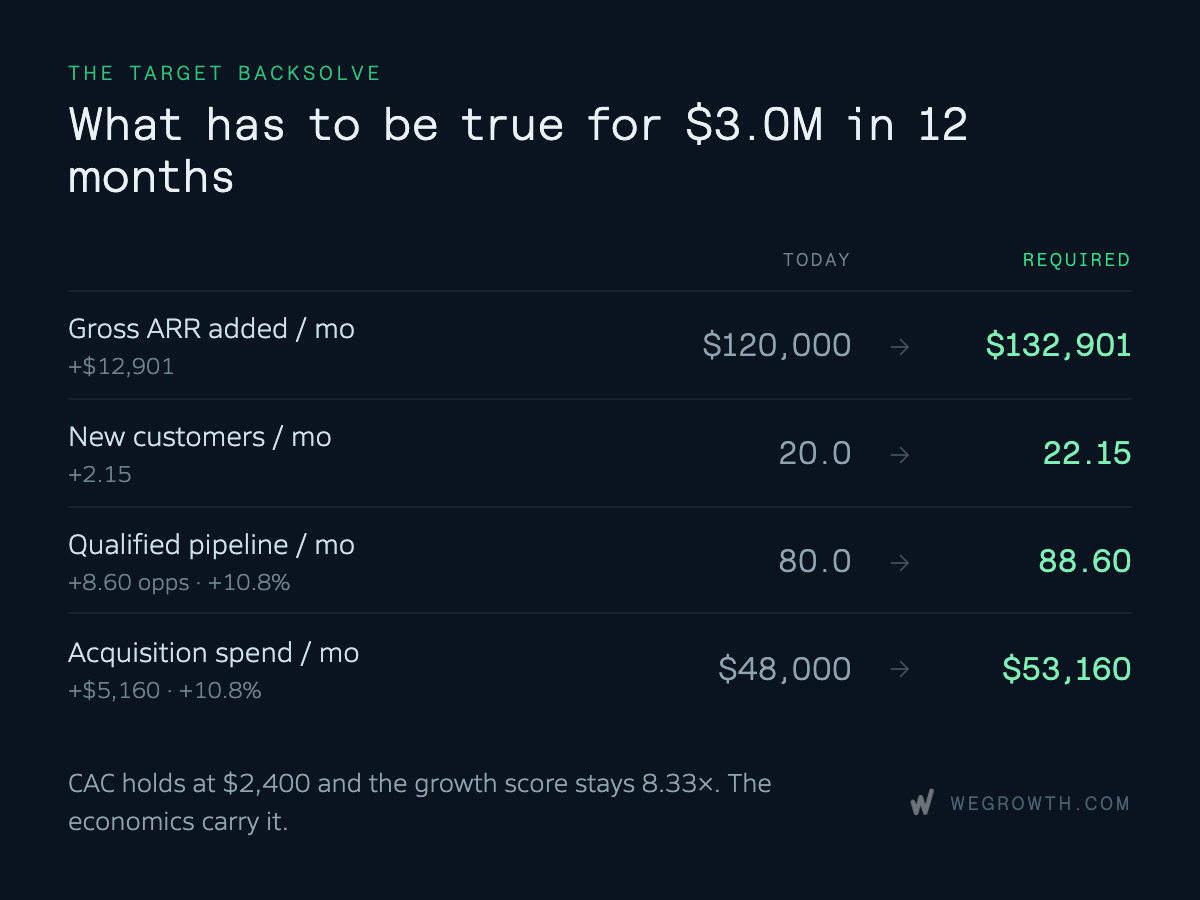
In the workbook's Backsolve tab, the logic inverts. Instead of asking where today's numbers will take you, you specify your target ARR and timeline, and the sheet calculates the required operational specifications.
For the pre-populated reference company aiming for $3.0M ARR in 12 months, the Backsolve tab produces these required specifications:
Checking Unit Economic Sanity
When you enter your own numbers, the Backsolve tab immediately reveals your operational gap. In the reference example, closing the gap requires producing 8.6 additional qualified opportunities per month, requiring $5,160/mo in additional marketing spend at current efficiency.
The model also checks whether the required spend breaks your unit economics: at $53,160/mo for 22.15 customers, CAC remains $2,400 and the Growth Score remains 8.33x—far above the 3.0x floor. The unit economics easily support the expansion.
Budget Headroom & Capital Allocation ("What Spend Buys")
The model's "What Spend Buys" tab inverts the 3.0x Growth Score floor into an Affordable Spend Ceiling:

When you plug in your own data, this tab answers: "How much can we afford to invest in growth before our economics become unprofitable?"
In the pre-populated example, the business has $85,333/month in available headroom, proving that the company is not capital-constrained by its unit economics. It has ample room to invest in high-leverage acquisition channels—such as scaling targeted campaigns with B2B SaaS LinkedIn Ads agencies or compounding long-term organic authority with B2B SaaS SEO agencies—as well as SDR hiring or outbound tooling to close the 8.6 opp/month gap without risking profitability.
Scenario Simulation: Playing with the Dials
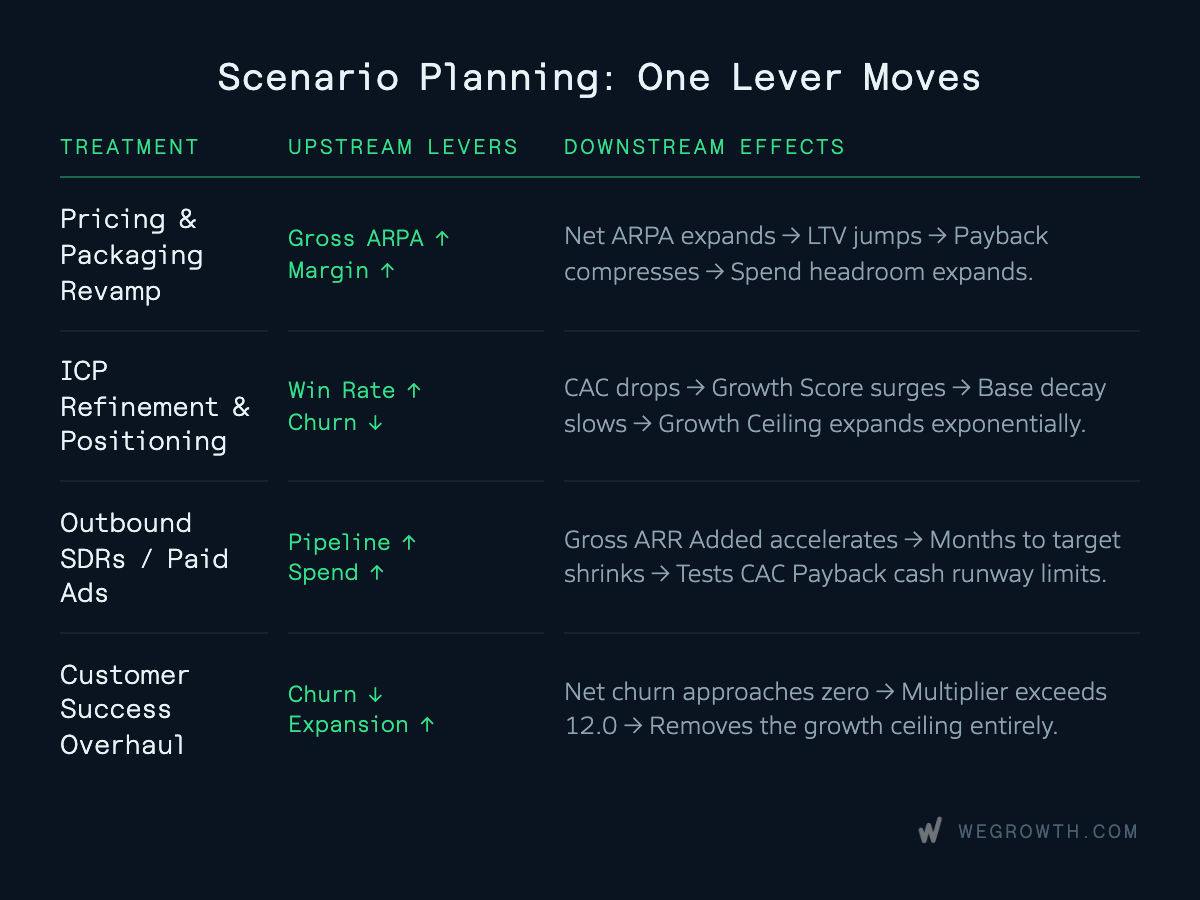
The true power of deploying the model is using the Dashboard and scenario columns as an operational sandbox to simulate strategic growth decisions before deploying capital.
Once your baseline is established in the Inputs tab, you can adjust individual levers in the scenario column to see how changes percolate throughout the entire model—from CAC and payback speed to the growth ceiling and final cash requirements.
Wishful Thinking vs. Grounded Operational Judgment
Entering improved numbers into a model is, by definition, an exercise in wishful thinking: you are asking "What if our win rate reaches 28%?" or "What if churn drops to 1.8%?"
The difference between fantasy forecasting and strategic modeling comes down to grounded operational judgment:
- The Fantasy Approach: Arbitrarily projecting higher revenue without specifying which operational rate changes or why.
- The Strategic Modeling Approach: Proposing a specific, credible operational initiative—such as identifying conversion bottlenecks across the SaaS customer journey or re-aligning your positioning with an updated SaaS GTM strategy to lift win rate by 3 points—plugging that delta into the scenario column, and seeing exactly how that single change cascades through your ARR trajectory, growth ceiling, and budget headroom.
Conclusion: The Clarity of the Machine
There is a profound shift that occurs when you replace guesswork with arithmetic.
Ambition alone is fragile. When a revenue target is just an aspiring line drawn across a pitch deck, every missed monthly forecast creates anxiety, and every executive review becomes an exercise in defending optimism.
A strategic growth model replaces that uncertainty with command.
When you understand the interconnected physics of your business—how pricing cascades into payback speed, how retention governs your growth ceiling, and how compounding cohort decay shapes your true trajectory—you no longer have to hope your company reaches its target. You can engineer it.
You can walk into a boardroom, an all-hands, or an investor meeting and speak with absolute conviction. You aren't asking stakeholders to believe in a fantasy; you are showing them the exact operational circuit: the pipeline required, the unit economics that justify the budget, and the precise levers that make the outcome inevitable.
Jimmy Greaves didn't rely on luck to score 25 goals; he engineered 500 entries into the box.
Now you have the engine. Open the model, plug in your numbers, and take command of your growth.
Where to Start
- Pull Your Six Baseline Numbers: Average your trailing qualified pipeline, win rate, ARPA, gross margin, logo churn, and total acquisition spend over the last 3 to 6 months.
- Open the Inputs Tab: Download our SaaS Growth Model Template and enter your six numbers into the yellow cells to overwrite the pre-populated reference data and establish your current baseline.
- Run the Backsolve First: Look at your required pipeline and spend in the Backsolve tab. The difference between what you produce today and what the model requires tells you within five minutes whether your 12-month goal is a manageable operational stretch or an impossible fantasy.
- Inspect Your Ceilings & Play with Scenarios: Check your Growth Ceiling to ensure your target is mathematically achievable at your current retention rate, check your Budget Headroom, and tweak the scenario dials to find the most efficient path forward.