Before customer journey mapping became a staple of SaaS, it started with SAS: Scandinavian Airlines.
In 1981, the airline realized customer loyalty wasn't won in the air, but across 50,000 daily "moments of truth," from ticketing to baggage claim. That operational shift laid the foundation for modern customer journey mapping.
In SaaS, the parallel is direct: your software is just the flight. The real journey is everything that gets a user on board, up to speed, and renewed for another year.
Mapping that journey stage by stage gives your team three things at once: a shared mental model of how customers actually buy, a concrete blueprint to plan marketing and product initiatives, and a diagnostic tool to evaluate whether each handoff held up. It pinpoints exactly where potential buyers get stuck, the content and touchpoints needed to move them forward, and the proving metric that confirms progress.
The architecture of a SaaS customer journey map
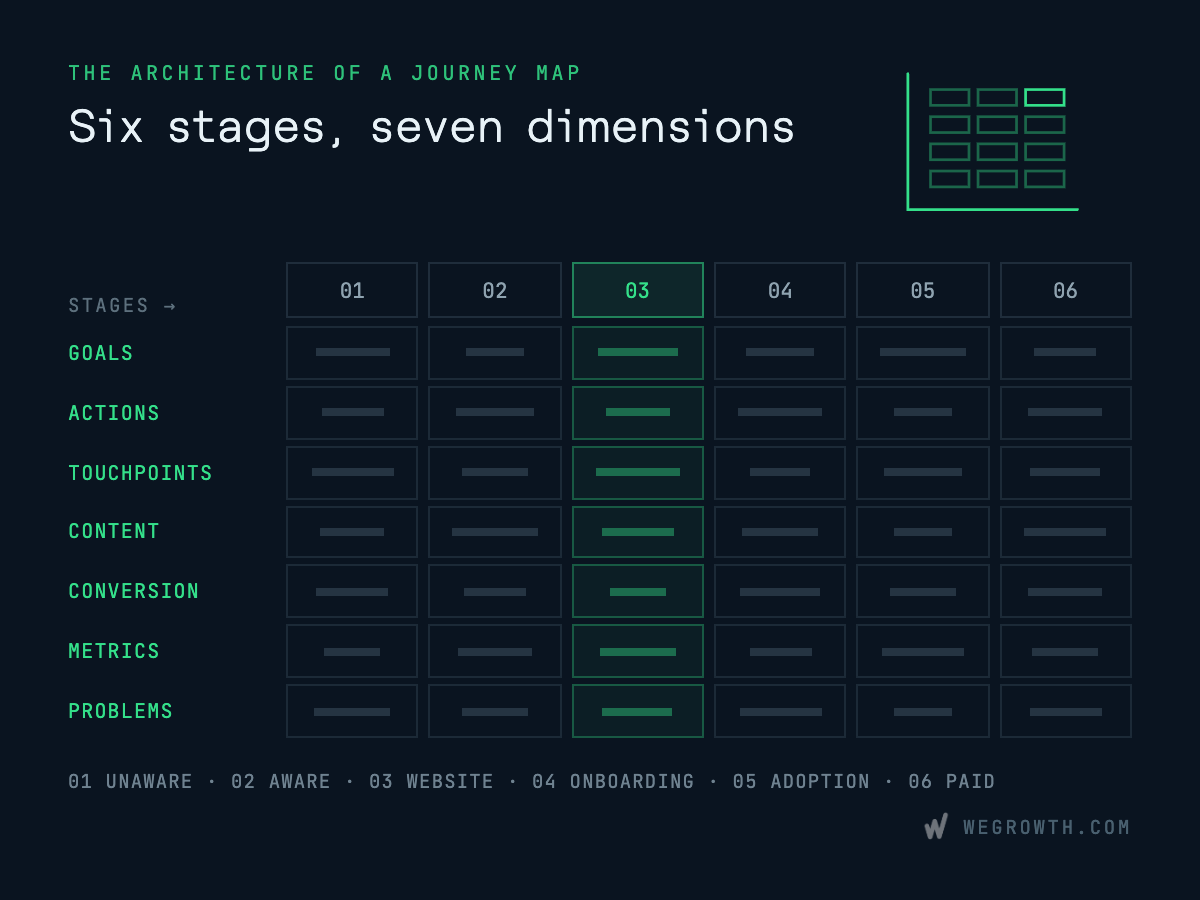
You can break a customer journey into three stages or thirty. At WeGrowth, we have worked with nearly every variation across our client portfolio, and the pattern is consistent: over-engineered maps become abandoned wall art, while oversimplified funnels fail to diagnose real friction.
We settled on a six-stage model because it hits the operational sweet spot. It structures the customer lifecycle into a two-axis working matrix simple enough to run in a spreadsheet (you can download our Customer Journey Map template and follow along):
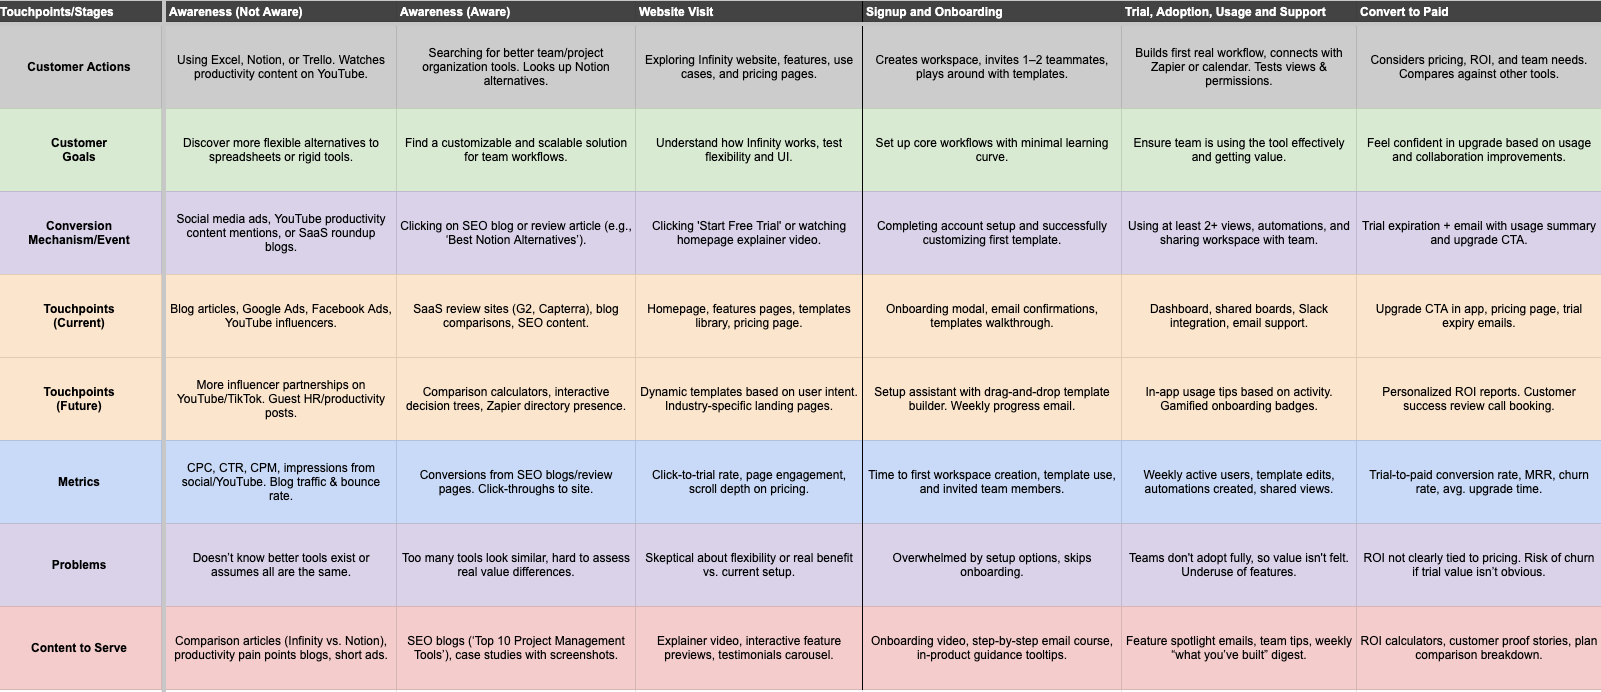
- The horizontal axis (Columns): The six chronological stages a customer lives through:
Awareness (Not Aware) → Awareness (Aware) → Website Visit → Signup and Onboarding → Trial, Adoption, and Usage → Convert to Paid. - The vertical axis (Rows): The eight diagnostic dimensions evaluated at every stage:
- Customer Goals: What are they actually trying to accomplish right now?
- Customer Actions: What are they doing concretely to get there?
- Touchpoints (Current): Where do they encounter you today?
- Touchpoints (Future): What high-leverage touchpoints should you build next?
- Content to Serve: What specific asset must exist at that touchpoint to guide them?
- Conversion Mechanism: What action moves them to the next stage?
- Proving Metric: What single number proves progress occurred?
- Problems: Where does this particular stage tend to break?
Answer these questions for every stage, and the result is your complete operational map. Skip the customer goals and actions, and touchpoints become blind assumptions. Skip the "content to serve" row, and you leave touchpoints without assets to guide the buyer. Skip the metric, and diagnosing friction remains an untested opinion without supporting data.
Crucially, a customer journey operates as a chain of dependent events. Pouring budget into top-of-funnel awareness makes commercial sense only when downstream stages—onboarding, adoption, and checkout—are built to capture and retain that demand. Conversely, leaving any single stage completely unaddressed creates an operational vacuum where buyer momentum simply evaporates. To launch effectively, you need a minimum viable customer journey: at least one anchor asset engineered across all six stages before you begin scaling spend.
These six stages follow chronological order—the sequence a customer actually experiences. That sequence does not dictate where your team should focus its initial mapping and optimization effort.
Focus your investigative and sprint resources on the stages where your team faces the highest uncertainty or greatest revenue risk. A company with years of predictable top-of-funnel acquisition but a newly launched pricing tier has far more at stake in Convert to Paid than in Awareness. A team that just redesigned its product walkthrough has more at stake in Signup and Onboarding than in a stable Website Visit funnel.
To make this matrix concrete, this guide follows one real product-led company through all six stages: Infinity, a flexible workspace and project management platform. What follows walks through how both axes work together in practice for each stage.
The 6 Stages of the SaaS Customer Journey
Stage 1: Awareness (Not Aware)
In this stage, prospective customers experience operational friction daily, but have not named a software solution or started looking for one. They treat manual workarounds, fragmented communication, and disorganized workflows as an unavoidable cost of doing business.
Your addressable audience at this stage is never a static list of accounts you can market to once. As advertising pioneer Bruce Barton observed (and David Ogilvy later popularized), you are communicating with a "moving parade." A company that ignored your message three months ago when their 5-person team was doing fine on spreadsheets might desperately need you today because they hired ten people and their manual processes are collapsing under scale.
Because companies drift into these problem states continuously—and usually tolerate the friction until a specific trigger like a missed deadline occurs—Stage 1 requires an always-on presence. Since these buyers aren't actively searching for software yet, your touchpoints must proactively push problem-focused content into the channels they already visit during the workday.
- Customer Goals: Relieve daily operational friction and stop wasting time on manual workarounds.
- Customer Actions: Venting about inefficient processes, searching for productivity hacks, or tolerating messy spreadsheets.
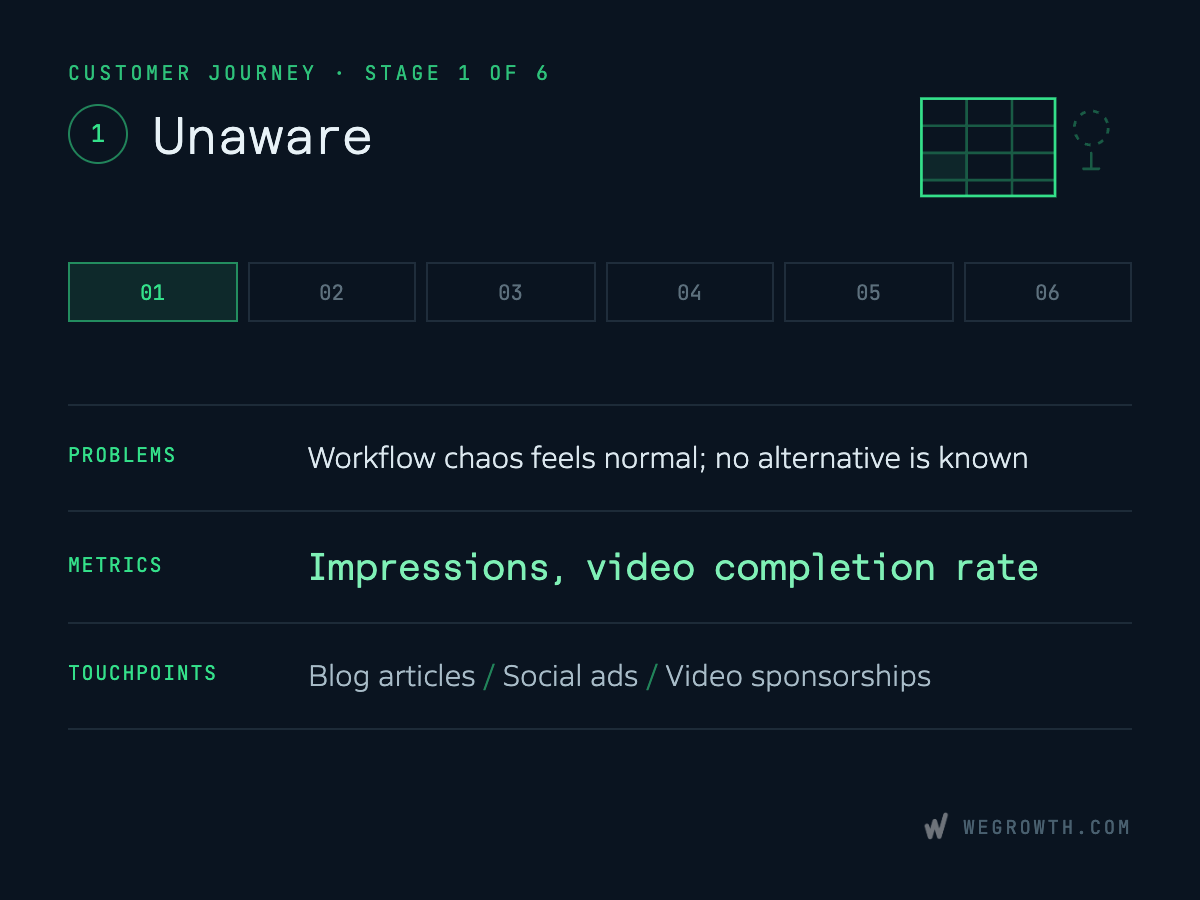
- Touchpoints (Current): Blog articles, Google Display/Discovery ads, paid social campaigns, video sponsorships.
- Touchpoints (Future): Industry benchmark reports, interactive workflow audit quizzes.
- Content to Serve: Problem-naming articles, workflow teardowns, productivity breakdowns, and short video ads.
- Conversion Mechanism: Engaging with problem-focused content and recognizing that workflow chaos is a solvable software problem.
- Proving Metric: Problem-focused organic blog traffic, video completion rates, and top-of-funnel CTR.
- Problems: Unaware that dedicated software exists, accepting workflow chaos as normal.
Infinity Example: Addressing Stage 1 began with a single pre-launch article titled "Goodbye, Trello," demonstrating how basic kanban boards break under scale. Having that anchor asset in place gave early category demand a place to land before building a full content engine.
Stage 2: Awareness (Aware)
In this stage, prospective buyers have crossed the threshold from tolerating background friction to actively seeking a software solution. They have named their operational problem and are exploring the category to identify, compare, and shortlist viable platforms.
Stage 1 and Stage 2 operate on entirely different competitive dynamics. In Stage 1, any competitor raising category awareness expands the total market for everyone. In Stage 2, that shared interest ends: buyers are actively comparing specific tools, and vendors compete directly to capture that intent.
In B2B SaaS, the person evaluating options is rarely the sole decision-maker. Even when an internal champion is personally sold on a standout feature, recommending new software means staking their own professional reputation and political capital. If the tool fails to adopt, creates security concerns, or exceeds budget, the champion carries the downside.
As direct-response pioneer Victor Schwab observed in How to Write a Good Advertisement, every buyer requires rational justification for a purchase chiefly so they can defend their decisions to others. In B2B, that justification functions as downside protection: it arms the champion with documented proof (security compliance, transparent pricing, and feature parity comparisons) to defend their recommendation to backroom stakeholders. Failing to provide this content drives up unqualified traffic and bloats customer acquisition costs.
- Customer Goals: Find and shortlist the best customizable software for their team's specific workflows.
- Customer Actions: Googling competitor comparisons, checking review sites, and reading category roundups.
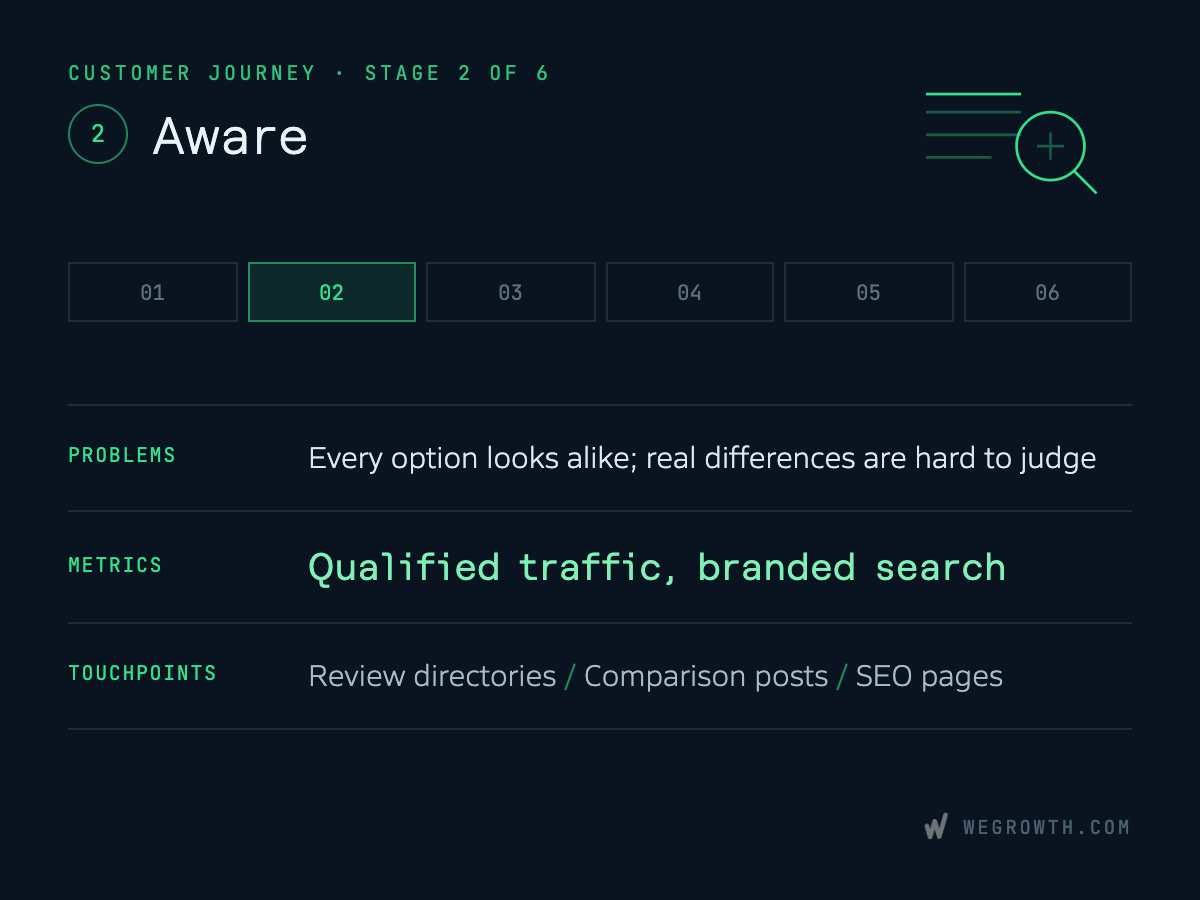
- Touchpoints (Current): SaaS review directories (G2, Capterra), comparison blog posts, high-intent SEO pages.
- Touchpoints (Future): Interactive tool-comparison calculators, downloadable RFP templates.
- Content to Serve: Category roundups ("Top 10 Project Management Tools"), direct comparison guides ("Tool A vs. Tool B"), and feature evaluation checklists.
- Conversion Mechanism: Clicking through from a comparison article, category roundup, or review profile to the website.
- Proving Metric: Conversions from SEO comparison pages, qualified organic traffic, and branded search volume.
- Problems: Tools look identical on the surface; difficult to evaluate true flexibility from marketing copy alone.
Infinity Example: Infinity intercepted high-intent comparison queries like "Notion alternatives" and "Trello vs Notion" with detailed comparison tables and G2 review profiles highlighting their flexible database and folder structure.
Stage 3: Website Visit
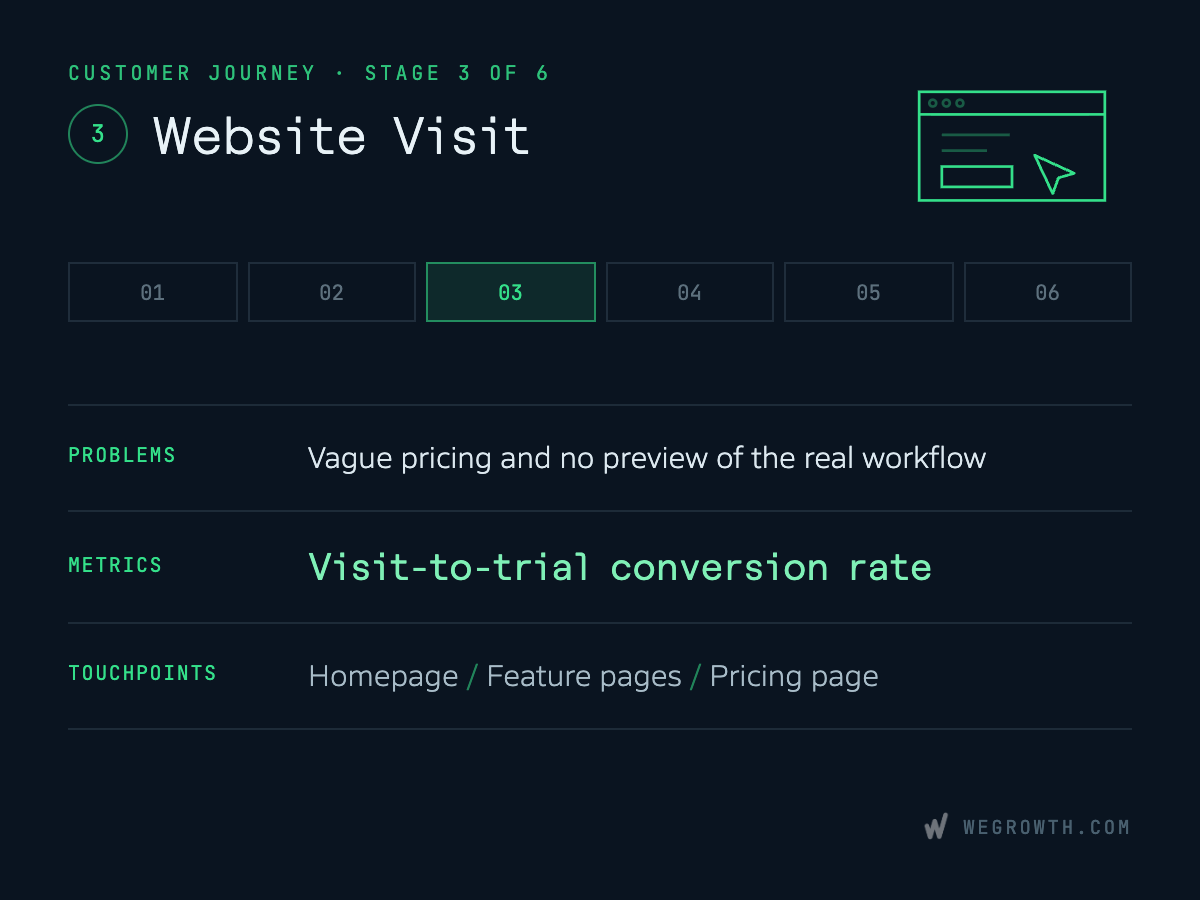
The prospect lands on your web property and has to verify within seconds whether your software solves their specific use case, fits their technical requirements, and aligns with their budget.
Conversion teams frequently make the mistake of evaluating landing pages in isolation, stripping form fields or overpromising simplicity to inflate raw trial numbers. A customer journey operates as a chain of dependent events: your website must qualify visitors honestly for downstream adoption, while diagnosing upstream traffic to ensure inbound ads and search queries carry genuine buying intent. Tactical landing page conversion improvements must serve long-term product adoption rather than isolated click-through rates.
- Customer Goals: Verify whether the platform fits their exact use case, team size, and budget.
- Customer Actions: Browsing feature pages, reviewing pricing tiers, exploring template galleries, and checking integrations.
- Touchpoints (Current): Homepage, feature overview pages, template library, pricing page.
- Touchpoints (Future): Self-guided interactive product demo (e.g., Navattic/Storylane), live chat routing for enterprise visitors.
- Content to Serve: Message match aligned with inbound search queries, interactive template previews, and transparent pricing breakdowns.
- Conversion Mechanism: Clicking "Start Free Trial" or testing an interactive product walkthrough.
- Proving Metric: Visit-to-trial conversion rate, pricing page scroll depth, and template view rate.
- Problems: Ambiguous pricing tiers, unclear feature differentiation, or inability to preview specific workflows before signing up.
Infinity Example: Infinity implemented an interactive template gallery with visual previews of tables, columns, calendars, and lists so evaluating teams could immediately see their exact workflow inside the product before creating an account.
Stage 4: Signup and Onboarding
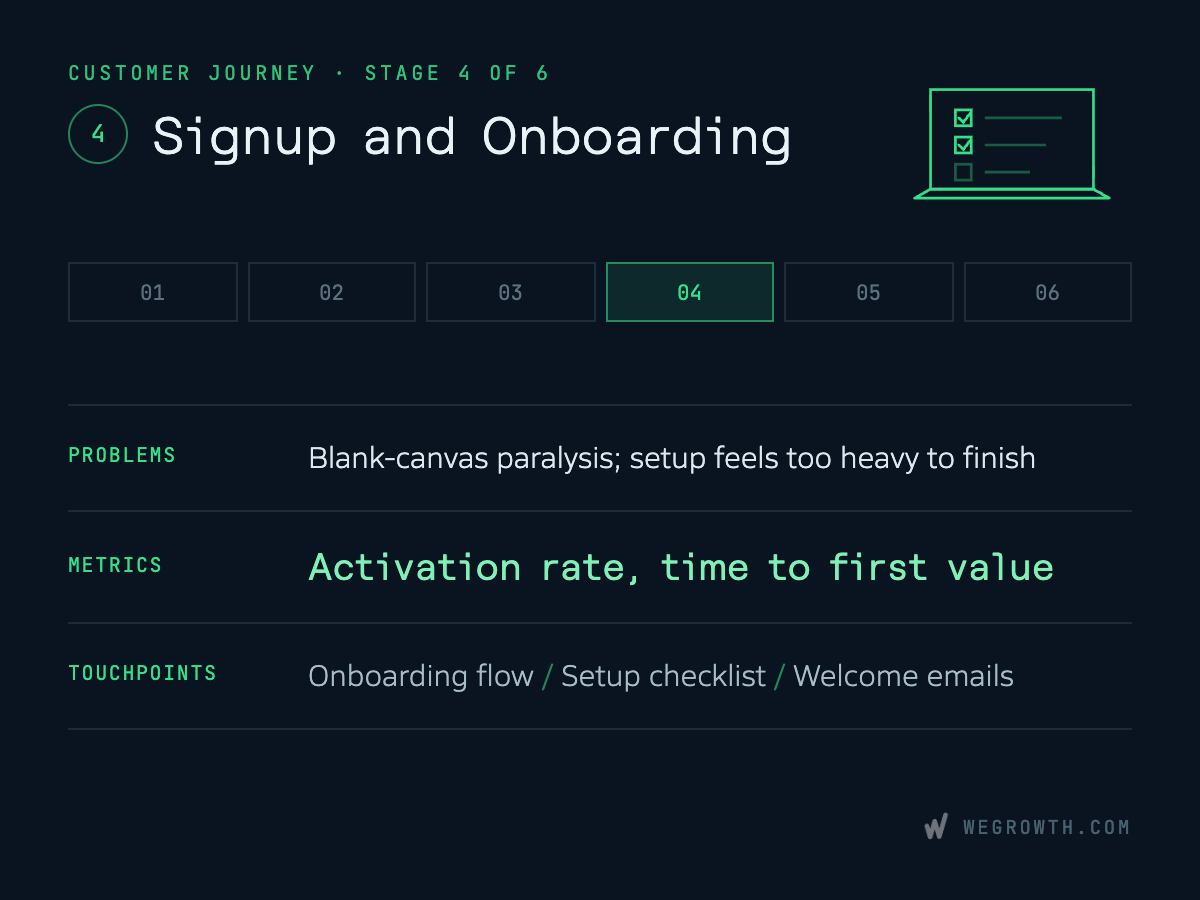
The prospect creates an account and enters the highest-friction transition in the software lifecycle. Onboarding is where initial buying momentum either converts into product habit or evaporates into setup fatigue.
The universal mistake at this stage is confusing setup completion with value delivery. Guiding a user through a generic product tour does not equal activation. True activation occurs only when the customer completes a verifiable action that solves their primary operational problem.
This stage also represents the fastest feedback loop in your entire growth engine. By watching session recordings, analyzing step drop-offs, and reviewing questions submitted to live chat, product and marketing teams can diagnose onboarding friction within hours.
- Customer Goals: Get core workflows configured quickly without getting bogged down in complex settings.
- Customer Actions: Completing signup, inviting initial teammates, selecting a starter workspace template.
- Touchpoints (Current): Onboarding modal wizard, template selector, welcome email sequence, in-app setup checklist.
- Touchpoints (Future): Role-based adaptive onboarding flows, automated in-app video tutorials.
- Content to Serve: Pre-populated starter templates, short video setup walkthroughs, and trigger-based onboarding emails.
- Conversion Mechanism: Completing a defined activation milestone that delivers initial core value.
- Proving Metric: Activation rate (percentage of signups completing the core value action) and time-to-first-value (TTFV).
- Problems: Blank canvas paralysis, excessive setup complexity, users skipping onboarding prompts.
Infinity Example: Infinity defined activation not as completing the setup wizard, but as creating a workspace, loading a starter template, and adding 5 or more active items.
Stage 5: Trial, Adoption, and Usage
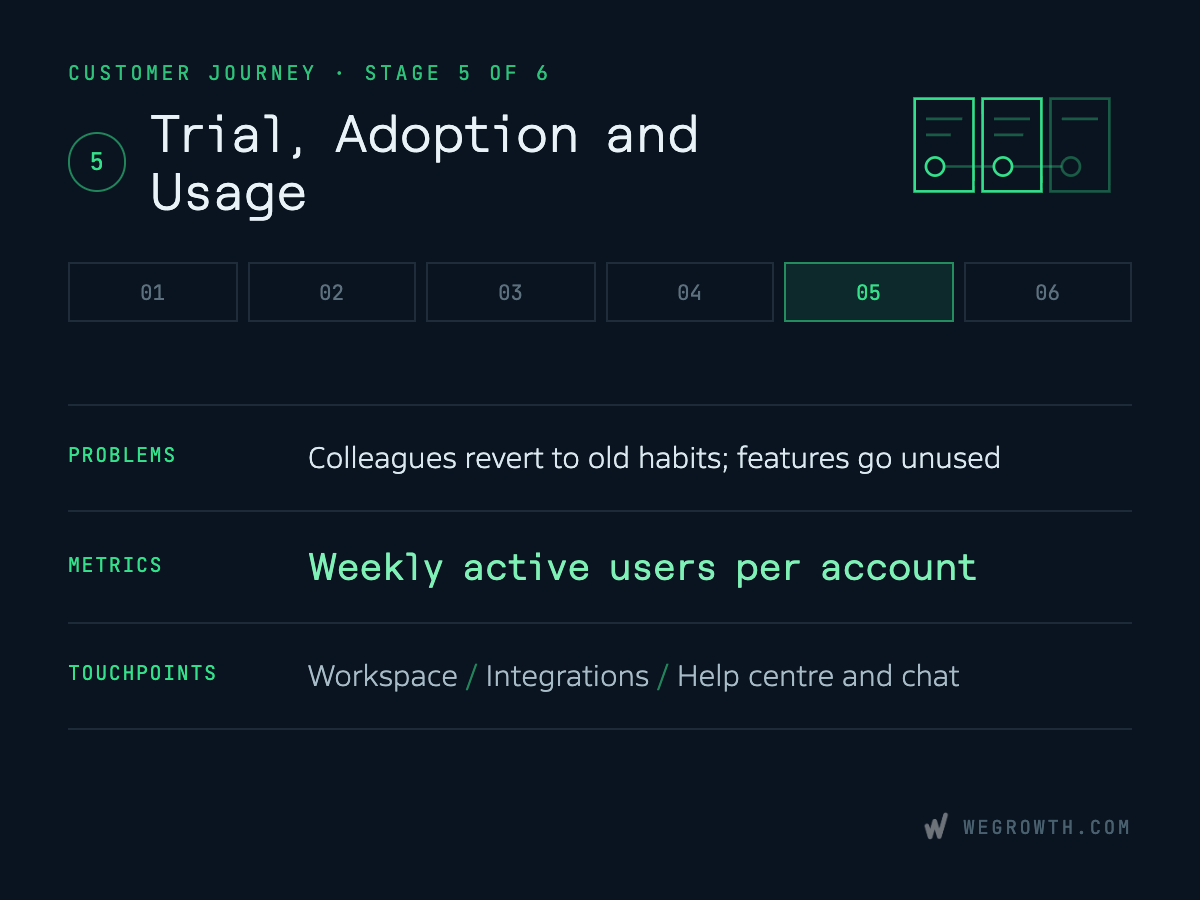
A single enthusiastic user signing up rarely guarantees company-wide adoption. Stage 5 evaluates whether individual product discovery expands into sustained, multi-user team collaboration.
In multi-user SaaS, the initial champion frequently loves the product while their colleagues quietly abandon it and revert to old habits. If your metrics only track the champion's login frequency, you remain completely blind to impending churn until the trial expires. Tracking team-wide engagement, shared views, and collaborative activity is essential to verifying real adoption.
- Customer Goals: Embed the software into daily team routines and confirm colleagues actively use it.
- Customer Actions: Collaborating on tasks, sharing board links in Slack, building custom dashboards, asking support questions.
- Touchpoints (Current): In-app workspace, shared dashboards, Slack/collaboration integrations, help center, chat support.
- Touchpoints (Future): In-app team collaboration nudges, automated champion check-in workflows.
- Content to Serve: Departmental rollout guides, team training webinars, workflow automation recipes, responsive chat support.
- Conversion Mechanism: Multi-user adoption, where secondary teammates actively create and update tasks without administrative prompting.
- Proving Metric: Weekly Active Users (WAU) per workspace, collaborative actions per week, and shared asset views.
- Problems: Teammates find the interface unfamiliar and quietly return to spreadsheets; champion lacks internal training materials.
Infinity Example: Infinity monitored whether a second and third teammate joined the workspace and began updating shared boards, supported by in-app team collaboration tips and automated Slack notifications.
Stage 6: Convert to Paid
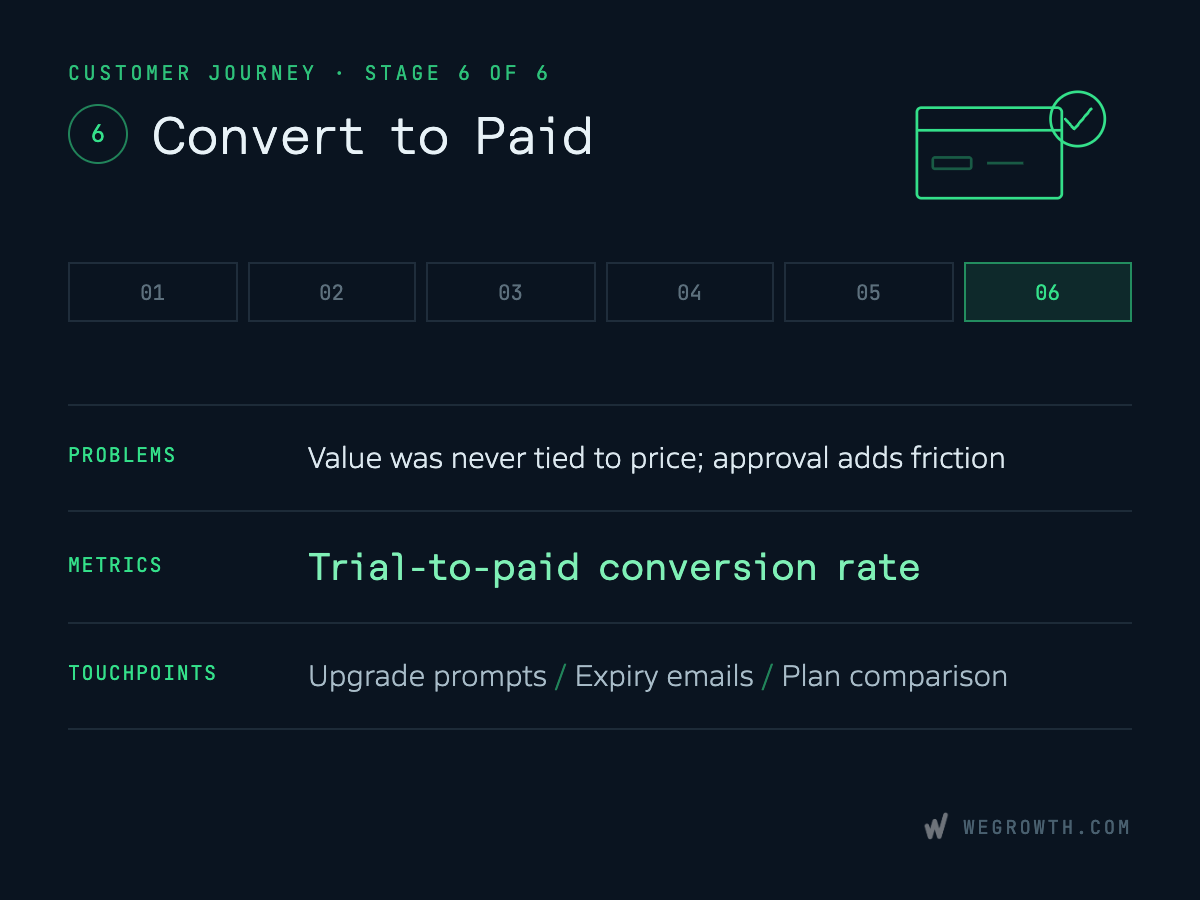
As the evaluation window closes, the buying team must decide whether the software delivered enough quantifiable value to justify recurring budget.
A trial that concludes without clear proof of value forces the buyer to reconstruct benefits from memory. In most B2B buying scenarios, frontline users may enjoy the software, but the economic buyer holding the corporate credit card hesitates without documented ROI.
At this stage, loss aversion becomes a decisive growth driver. Once an entire team embeds its daily workflow into an organized platform, reverting to messy spreadsheets feels significantly more painful than it did before. Your conversion touchpoints must arm the champion with quantifiable usage data showing work completed and hours saved to make approving the purchase seamless. Ensuring this conversion velocity yields healthy customer lifetime value relative to CAC is what determines your overall SaaS unit economics.
- Customer Goals: Secure team and budget approval to upgrade confidently without workflow disruption.
- Customer Actions: Reviewing paid plans with stakeholders, entering billing details, selecting annual vs. monthly billing.
- Touchpoints (Current): In-app upgrade prompts, trial-expiration email sequence, plan comparison modals.
- Touchpoints (Future): Automated team ROI reports, executive summary one-pagers for finance approval.
- Content to Serve: Automated trial usage summaries, team ROI calculators, and side-by-side plan comparison breakdowns.
- Conversion Mechanism: Submitting payment details and activating a paid subscription.
- Proving Metric: Trial-to-paid conversion rate, average time to upgrade, and Net New MRR added.
- Problems: Hitting plan limits before securing internal approvals, confusion over feature tiers, checkout friction.
Infinity Example: Infinity sent automated trial summary emails highlighting all tasks and projects completed across the workspace during the trial, giving the team lead immediate proof of value before the upgrade prompt appeared.
Putting the Six Stages Together: The Operational Matrix
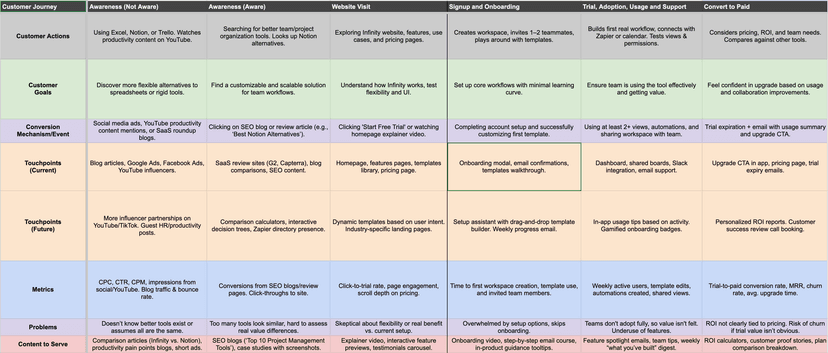
When mapped across both axes, the six stages form a complete operational matrix. Here is the full framework populated for Infinity:
[!TIP] Get the template: You can make a copy of the WeGrowth Customer Journey Map in Google Sheets with the Infinity example pre-filled and a blank tab ready for your team.
| Stage | Customer Goal | Touchpoints (Current) | Touchpoints (Future) | Proving Metric |
|---|---|---|---|---|
| Awareness (Not Aware) | Discover flexible alternatives to rigid tools | Blog articles, Google Ads, Facebook Ads, YouTube sponsorships | Industry benchmark reports, workflow audit quiz | Problem-focused organic blog traffic, video completion rate |
| Awareness (Aware) | Find a customizable solution for team workflows | SaaS review sites (G2, Capterra), blog comparisons, SEO content | Interactive comparison tool, RFP evaluation template | SEO conversions from comparison pages, branded search volume |
| Website Visit | Test flexibility, UI, and pricing fit | Homepage, feature pages, templates library, pricing page | Interactive self-guided product demo, live chat routing | Visit-to-trial conversion rate, pricing page scroll depth |
| Signup and Onboarding | Set up core workflows with minimal friction | Onboarding modal, template walkthrough, welcome email | Role-based adaptive onboarding, in-app video tutorials | Activation rate (workspace & template setup), TTFV |
| Trial, Adoption, and Usage | Ensure team adopts the tool and gets daily value | Dashboard, shared boards, Slack integration, chat support | In-app team collaboration nudges, champion check-in workflows | Weekly active users (WAU) per workspace, collaborative actions |
| Convert to Paid | Upgrade confidently based on collaboration ROI | In-app upgrade CTA, pricing page, trial expiry emails | Automated team ROI reports, executive summary one-pager | Trial-to-paid conversion rate, average time to upgrade |
How to Read and Operationalize This Matrix
- Read horizontally (row by row): This gives you the chronological narrative of the customer transformation—what they need, what they do, and how they advance at each step.
- Read down "Touchpoints (Current)": This acts as an audit of every digital asset and channel your team actively maintains today.
- Read down "Touchpoints (Future)": This forms your prioritized sprint backlog for growth and product experiments.
- Read down "Proving Metric": This is your rapid diagnostic dashboard. When growth slows, this shortlist tells you exactly which stage is failing.
- Map by risk, not just left-to-right: You do not have to fill the columns in chronological order. Begin mapping and gathering data on the stages where your team faces the highest uncertainty or greatest revenue risk.
- Adding accountability (The Owner Column): If cross-functional friction is an issue for your team, add an Owner column assigning primary accountability (Marketing, Product, Sales, or Customer Success) per stage to eliminate handoff ambiguity.
Diagnostic Triage: Tracing Where a Drop-off Actually Starts
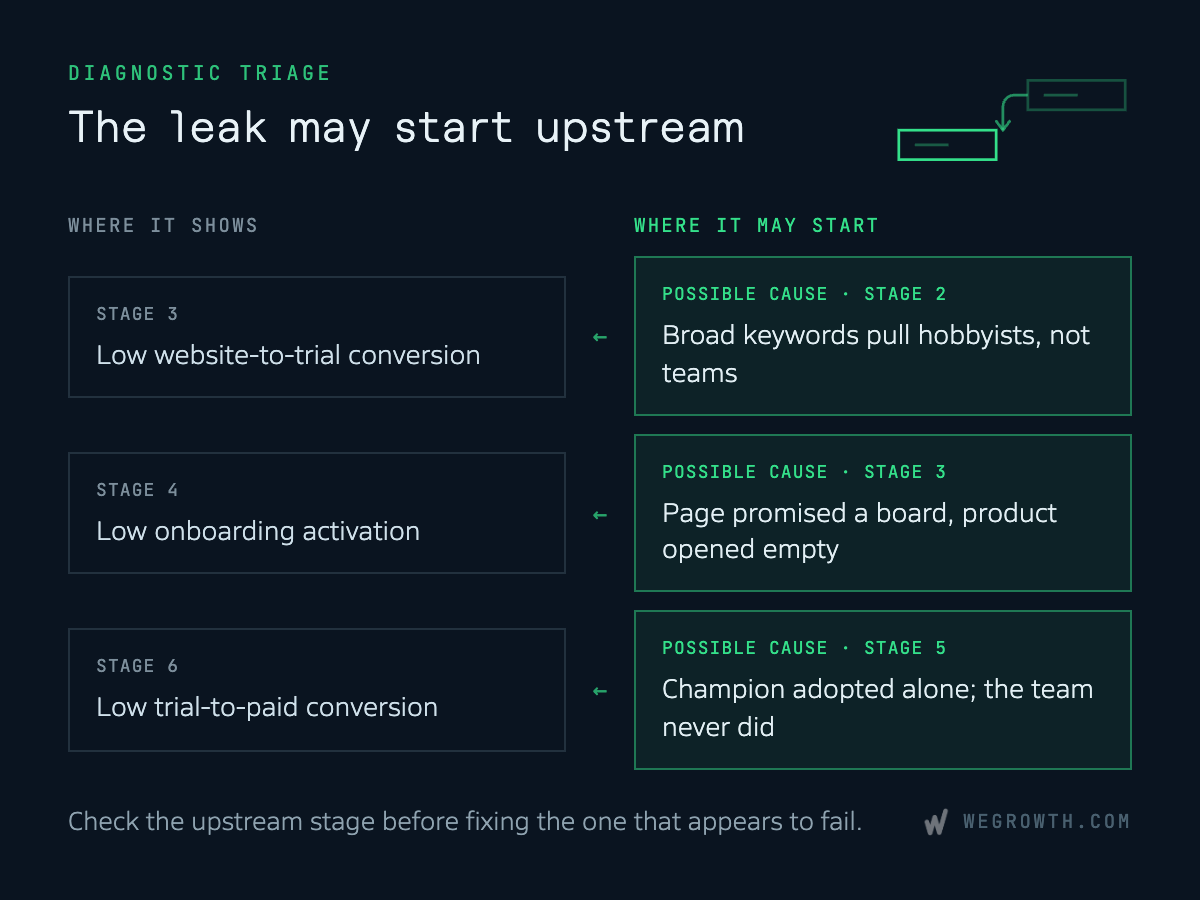
When a proving metric drops, teams instinctively look for friction within that exact stage. In practice, the breakdown almost always originates one stage upstream:
- Low website-to-trial conversion (Stage 3 leak): The root cause is rarely the color or placement of the signup button. It is usually an upstream intent mismatch in Stage 2—such as bidding on broad keywords that attract single-user hobbyists rather than collaborative teams.
- Low onboarding activation (Stage 4 leak): When signups fail to create a workspace or add tasks, the issue often starts on the Stage 3 landing page. If the page promised an intuitive visual board but the user is dropped into an empty database without a template, activation stalls immediately.
- Low trial-to-paid conversion (Stage 6 leak): When active trials fail to purchase, teams frequently assume pricing resistance. In most cases, the real issue is an adoption failure in Stage 5. The primary champion loved the interface, but lacked the departmental rollout guides needed to get their colleagues actively logging in.
The Three Critical Handoffs Where Journeys Go Quiet
A customer journey rarely breaks in the middle of a well-defined stage. It breaks at the seams where responsibility transitions from one team or user to another:
1. Marketing to Product (The Intent Handoff)
The transition from website visitor to active user requires seamless message match. If an ad or comparison article highlighted Infinity's agile sprint boards, the user's initial onboarding flow should automatically pre-load a sprint board template. Forcing them to choose from thirty unrelated options creates immediate friction.
2. Solo Champion to Team (The Adoption Handoff)
B2B software purchases are made by committees, but initial signups are almost always solitary. When a single team lead signs up, their personal activation is only step one. The critical friction point is helping that champion convince their colleagues to adopt the new workflow. Providing pre-built invitation flows, shared workspace templates, and team rollout playbooks protects the deal from dying as a single-seat experiment.
3. Product to Commercial (The Conversion Handoff)
In a pure self-serve motion, this handoff is automated through in-app usage summaries that demonstrate tangible team ROI before the trial expires. In a sales-assisted or hybrid motion, this is where Product-Qualified Leads (PQLs) route to Account Executives. Passing granular in-app activity (such as workspaces with five or more active collaborators) gives sales reps the exact context needed to lead with relevant workflow upgrades tailored to observed usage.
Where Product-Led and Sales-Led Maps Diverge
Infinity's journey above is self-serve: users discover, onboard, and convert without speaking to a sales rep.
A sales-led motion introduces entirely new stages. Between Website Visit and Signup, it adds lead qualification, product demos, and security reviews before anyone touches the software. Onboarding shifts from a self-serve flow to a formal implementation process, typically owned by customer success rather than the sales rep who closed the deal.
That handoff—from the account executive who closed the deal to the customer success manager who oversees implementation—is one of the two riskiest moments in the entire journey. (The other is activation.) Both are moments where customer ownership changes hands, and both are where journeys most often go quiet.
Most B2B SaaS companies operate a hybrid model: self-serve for smaller accounts, sales-assisted for mid-market and enterprise tiers. This requires maintaining two distinct sub-maps for stages 3 through 5. Trying to force a single map to describe both a 5-minute self-serve signup and a six-month enterprise sales cycle produces a framework too vague to be useful for either motion. Aligning campaigns and handoffs across both motions is often where SaaS growth marketing agencies focus when scaling beyond early product-market fit.
6 Traps That Turn Journey Maps into Abandoned Spreadsheets
The maps that get built once, presented in a meeting, and never opened again almost always fall into one of these six traps:
- Building one map for every buyer: In B2B, the buying committee consists of an economic buyer, a technical admin, and end users—each hitting different touchpoints. If you haven't mapped these distinct stakeholder roles yet, see our step-by-step guide to creating a customer persona.
- Treating "purchase" as the finish line: In SaaS, the majority of customer lifetime value and churn risk sits downstream in onboarding, adoption, and retention.
- Gating stages by calendar days instead of milestones: Defining stage boundaries by arbitrary time intervals (such as "Day 14") rather than concrete user actions (such as "invited 3 teammates") blinds you to true user progress.
- Tracking vanity metrics instead of a single proving metric: Listing ten disconnected KPIs per stage dilutes focus. Each stage needs one primary proving metric that unequivocally confirms progress.
- Skipping the "Content to Serve" row: Mapping touchpoints without engineering the specific content assets needed to guide users creates an operational vacuum.
- Leaving the map without an active owner: A journey map is a living set of testable hypotheses. Assigning a dedicated owner to monitor metrics and prioritize sprint experiments from the "Touchpoints (Future)" row is what keeps the document alive. For full KPI instrumentation, see the ultimate guide to SaaS growth marketing metrics.
Turning the Blueprint into an Active Growth System
A customer journey map is not a one-time deliverable; it is an operating system for your growth and product sprints.
Identifying where a stage breaks is the first step. Connecting that matrix to live in-app triggers, CRM alerts, and customer success playbooks is how you turn a spreadsheet blueprint into an automated growth engine.
To explore the wider measurement framework and align your customer journeys with precise buyer profiles, explore our companion guides: