Your Stripe dashboard shows new signups ticking up, your bank account shows cash bleeding out, and your co-founder turns their laptop toward you with a simple question: are we making money on these customers?
A proper SaaS unit economics model gives you the answer. It provides an explicit starting point to evaluate all your marketing efforts.
Upfront, it gives you guideposts for your inputs, showing how many team hours, tools, or ad dollars an idea can afford to consume. Downstream, it establishes benchmarks for your outputs, showing the conversion rates and revenue targets required to keep everything sustainable.
Whether you are testing a new channel, expanding a campaign budget, or adding a sales rep, you have a shared standard to evaluate the effort going in and the performance coming out.
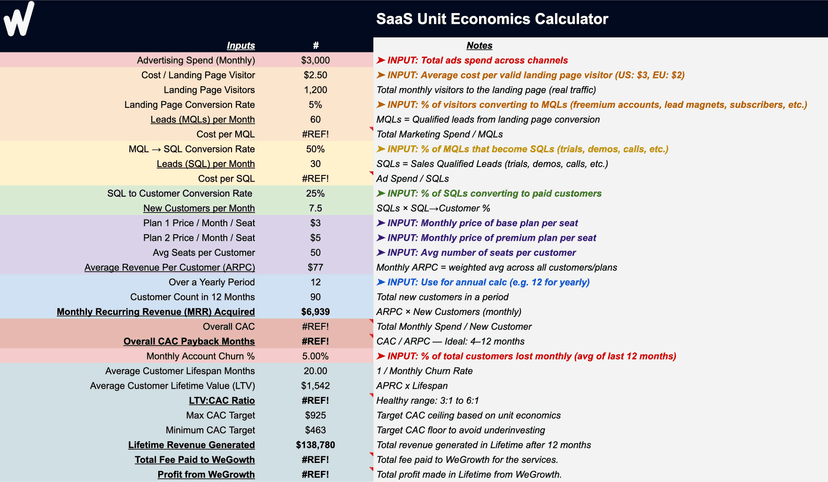
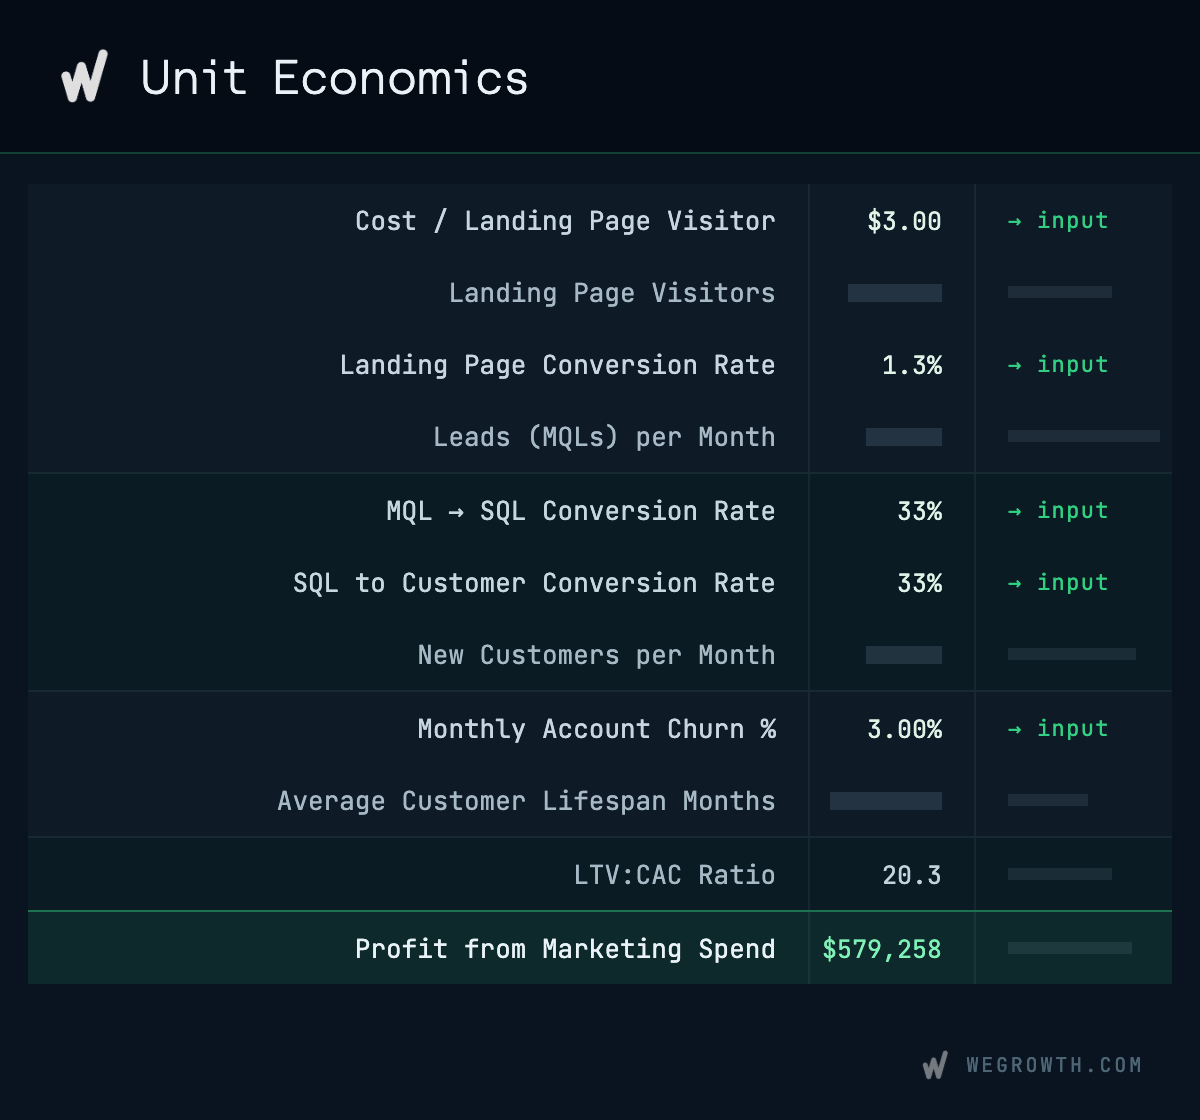
Try it with your own numbers. The model behind Company X runs on the Wegrowth SaaS unit economics calculator. Plug in your funnel and pricing, and it calculates CAC, LTV, LTV:CAC, and payback for you.
What SaaS Unit Economics Measure
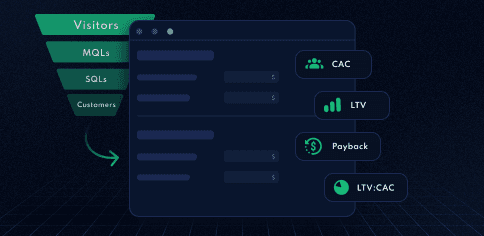
A "unit" in SaaS means one customer. Does the money they pay you, over the time you keep them, beat what it cost to win and support them? And does that money come back fast enough to keep the business running while you wait?
You need several numbers to answer that well. One number alone can trick you. A company can have a great LTV:CAC ratio and still run low on cash, because payback (how fast a customer's revenue repays what it cost to acquire them) is too slow. It can also have healthy customer-level numbers and still grow in a wasteful way at the company level.
Below, we build one example company, Company X, and carry it through the whole model, from the funnel that produces its costs to the four headline numbers those costs roll up into.
Company X, used throughout this guide:
- Paid ad spend: $1,000 a month
- 400 monthly visitors to its landing page, at $2.50 per visitor
- Converts visitors to customers through a 3% visitor-to-lead rate, a 50% lead-to-qualified rate, and a 25% qualified-to-close rate
- Sells two plans — $3 and $5 per seat a month, roughly a 70/30 mix — averaging 50 seats per customer
- 5% monthly customer churn
These numbers are Company X's best current read on its own funnel and market, not certainties. That's normal, and it's still useful: writing an assumption down as a number, instead of leaving it as a gut feeling, is what lets you check it against what actually happens and sharpen it over time.
Customer Acquisition Cost (CAC)
Formula: CAC = total sales and marketing spend, divided by new customers in that period.
The formula is simple. Getting the top number right is where most companies go wrong.
Blended CAC vs. Fully Loaded CAC
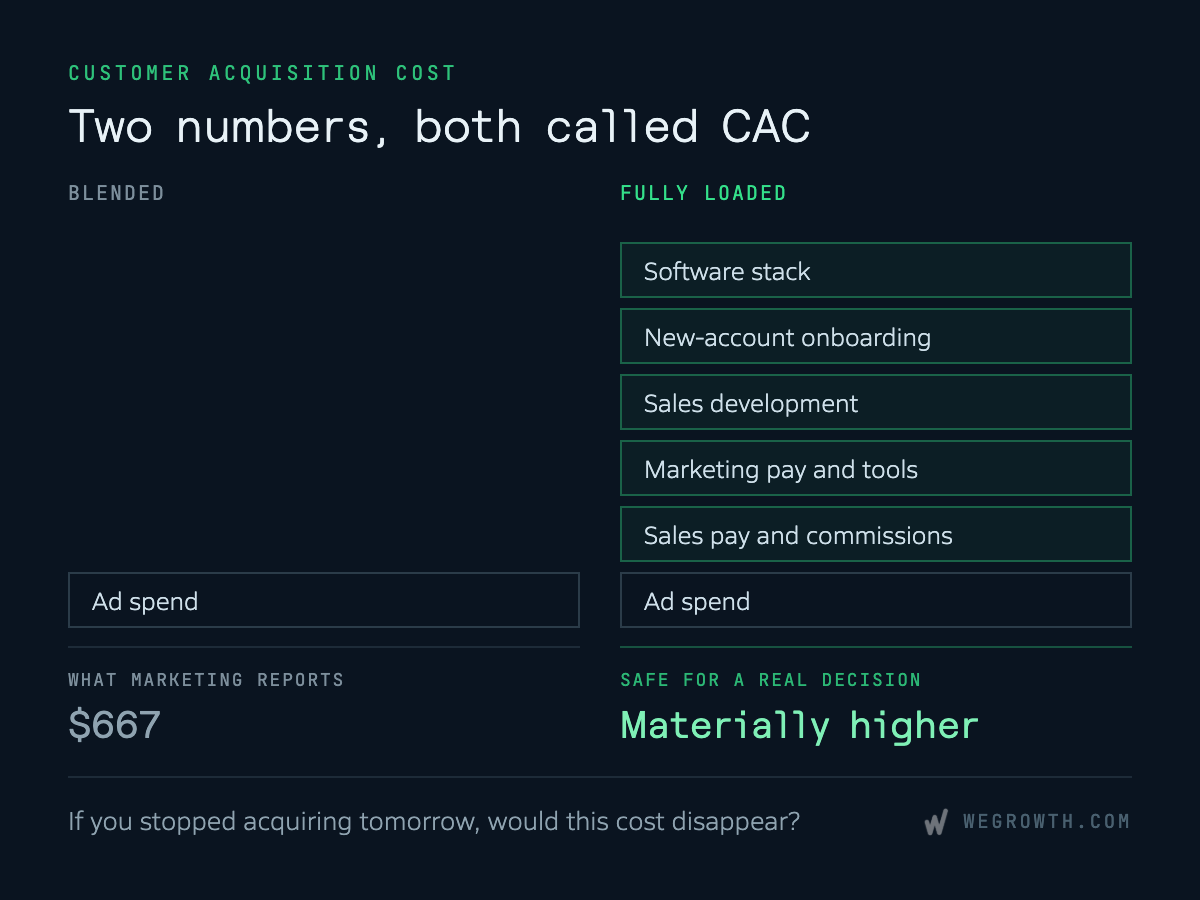
Blended CAC uses only ad spend, divided by new customers. It's the number that shows up first in an ads dashboard, and it's often the number marketing reports.
Fully loaded CAC counts everything that goes into winning a customer:
- Sales pay and commissions
- Marketing pay and tools
- Sales-development cost
- Onboarding cost for new accounts
- The software stack that supports all of it
Marketing's number and finance's number often don't match, and finance's fully loaded number is usually much higher. Use the fully loaded number for any real decision.
Simple test: if you stopped acquiring customers tomorrow, would this cost disappear? If yes, it belongs in CAC.
Company X's example below uses a single spend line — paid ads — to keep the funnel math easy to follow. If you also pay an agency retainer, contractor fees, or other overhead on top of media spend, fold it into the same numerator the same way: the formula doesn't change whether the dollars are media spend, salaries, or a retainer, only the total does.
The Topline Number, Calculated
Company X's funnel converts to about 1.5 new customers a month.
$1,000 ÷ 1.5 ≈ $667 CAC.
That's where most guides stop. It tells you what acquisition cost was.
It doesn't tell you if $667 is good, where that cost comes from in your funnel, or what you could safely spend to get more customers. The next two sections answer both, but the second one needs LTV first, so hold onto this number and keep reading.
Where CAC Actually Comes From: The Funnel-Stage Breakdown
Most guides treat CAC as one blended number, added up after the fact. Some marketing guides teach the funnel instead — visitor, MQL, SQL, customer — but rarely connect it back to LTV or payback.
Very few guides do both. This section shows how, using Company X's real funnel for one month.
| Stage | Volume | Conversion to next stage | Cost at this stage |
|---|---|---|---|
| Visitors | 400 | 3% → MQL | — |
| MQLs | 12 | 50% → SQL | $1,000 ÷ 12 ≈ $83 / MQL |
| SQLs | 6 | 25% → Customer | $1,000 ÷ 6 ≈ $167 / SQL |
| Customers | 1.5 | — | $1,000 ÷ 1.5 ≈ $667 / customer (CAC) |
Every number in that table comes from the same $1,000. Nothing new got added — we just split the same spend across the stages where it actually converts.
Here's what a blended CAC hides. Build this same breakdown again later with your actual numbers, and compare it stage by stage against this estimate.
Maybe traffic quality dropped. Maybe fewer MQLs turned into SQLs. Maybe the close rate fell.
A blended number can't tell you which stage moved. A stage-by-stage comparison can.
If the visitor-to-MQL stage specifically is the weak link, Improve Your Landing Page Conversions covers the tactics for that lever.
Customer Lifetime Value (LTV)
Formula: LTV = average revenue per customer × customer lifespan, in months.
Company X's average revenue per customer comes from blending its two plans — a $3 and a $5 per-seat plan, roughly 70/30 by mix — across an average of 50 seats per customer. The exact blend matters less than landing on one real number: what a typical customer pays, all in, every month.
Company X's LTV:
- Average revenue per customer = $180 a month
- Average customer life = 1 ÷ monthly churn rate = 1 ÷ 5% = 20 months
- LTV = $180 × 20 months = $3,600
A Note on Gross Margin
Many guides use gross-profit-adjusted revenue in this formula instead of raw revenue — average revenue per customer times gross margin, divided by churn — and it's the more accurate version. A company with high support costs per customer can overstate LTV by 40 to 60% using revenue instead of gross profit.
Company X's numbers above skip that adjustment, for simplicity. If your gross margin runs meaningfully below 100% — heavy infrastructure or support costs, for instance — swap in gross profit per customer (revenue × gross margin) for revenue in the formula above, and the same math still holds downstream.
Where LTV Gets Unreliable
LTV is the shakiest of the four numbers, especially early on. Below about $2M in ARR, your customer group is small and young, and a 1-point swing in churn can move LTV by tens of thousands of dollars. The math is real; the number is still noisy.
Strong negative churn — expansion revenue beating churned revenue — can push LTV toward infinity, which is a math quirk, not a real number to plan around.
Early on, treat LTV as a rough guide and lean on CAC payback instead. Payback only uses numbers you already have. LTV leans on a churn guess, stretched years into the future.
Survival analysis is a more rigorous way to estimate customer lifespan. The simple formula above, 1 divided by churn rate, assumes churn stays constant every month, which is rarely true. Churn is usually highest in a customer's first few months and drops the longer someone sticks around.
Survival analysis works differently. Instead of averaging one churn rate across your whole customer base, it tracks each signup cohort month by month, asking what percentage of the people who joined in January are still customers in February, in March, and so on.
Kaplan-Meier estimation is the standard method for building that curve, and it works even for customers who haven't churned yet, so you don't have to wait for every customer to leave before producing an estimate. The area under that retention curve, not a single averaged rate, is your expected customer lifespan.
The calculator above uses the simple version for speed. Reach for survival analysis once you have at least a year or two of cohort history, enough for the more detailed curve to actually change the answer.
LTV:CAC Ratio
Formula: LTV ÷ CAC.
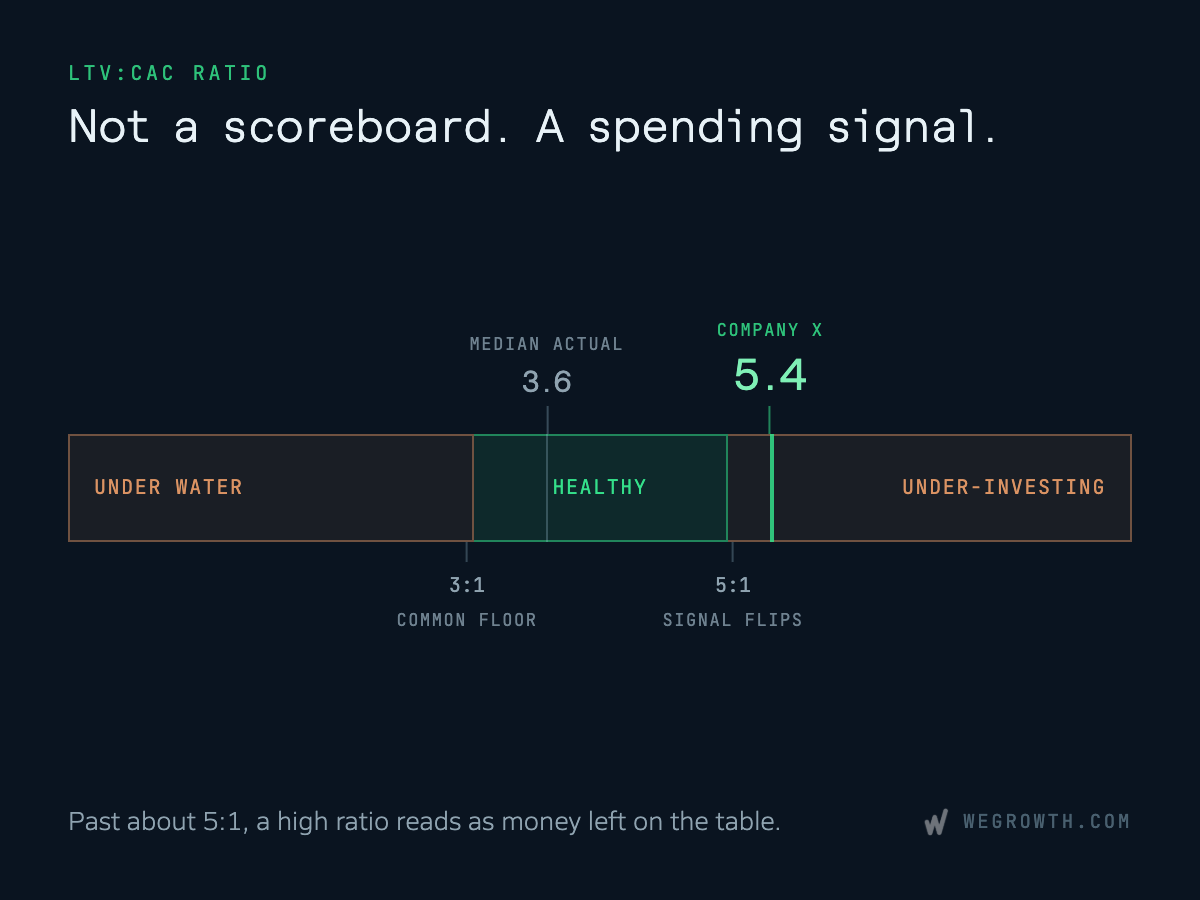
Company X: $3,600 ÷ $667 ≈ 5.4:1.
The common floor is 3:1. Below that, you likely aren't getting enough value per customer to justify what you spend to win them.
Benchmarkit's 2024 data puts the median actual ratio closer to 3.6:1 — most companies sit near the floor, not comfortably above it.
Company X's 5.4:1 looks strong, and it is — but it's already past the point (roughly 5:1) where broader market data suggests a ratio starts to reflect under-investment rather than outperformance, not further outperformance.
In other words, when the LTV:CAC ratio is too high, it indicates you're leaving money on the table by not investing more. The next section shows how much room that really means.
Setting a Target CAC — and Diagnosing Your Funnel
Most unit-economics content calculates CAC only after you've spent the money. Some guides use the funnel as a check, but only after payback or LTV:CAC already looks bad.
Almost none flip the math around: start with the payback period you're willing to accept, work out the most you can pay for a customer, and push that number back through your funnel. That tells you what you can pay for a visitor, an MQL, and an SQL, before you spend.
Step 1: turn an acceptable payback period into a target CAC. A common ceiling: don't let a customer take more than a year to pay back what it cost to win them.
Target CAC = ARPC × 12 months = $180 × 12 = $2,160.
That's also, not coincidentally, one full year of what Company X's average customer is worth — the ceiling is simply "don't pay more to win a customer than they're worth to you in a year."
For reference, a tighter, more efficient target — six months' payback instead of twelve — puts a floor under that spending, too: $180 × 6 = $1,080. Spend less than that and you're likely under-investing even by the efficient end of the range.
Step 2: push that target back through the funnel. Use Company X's real conversion rates: 25% from SQL to customer, 50% from MQL to SQL.
- Target cost per SQL = target CAC × SQL-to-customer rate = $2,160 × 25% = $540
- Target cost per MQL = target cost per SQL × MQL-to-SQL rate = $540 × 50% = $270
Step 3: compare target to actual.
| Stage | Actual cost | Target cost (12-month payback) | Headroom |
|---|---|---|---|
| Per MQL | $83 | $270 | 3.2x |
| Per SQL | $167 | $540 | 3.2x |
| Per customer (CAC) | $667 | $2,160 | 3.2x |
The gap is the same size at every stage, because Company X's conversion rates didn't change — only the limit did.
Here's the read: Company X isn't spending too little because its funnel is broken. It's spending too little compared to what its own numbers can support — its actual CAC doesn't even reach the $1,080 floor of the efficient range, let alone the $2,160 ceiling.
The fix isn't "fix the funnel." It's "put more money into the funnel that already works."
This same method flags the opposite problem too. If actual cost per SQL were above target, that's exactly where to look first, not the whole CAC number, just that one stage. Once you know which stage is driving the number up, How to Lower Customer Acquisition Costs covers the specific tactics for bringing it back down.
Some of what goes into this model is data you already have, like your actual spend, conversion rates, and churn. The rest isn't observed, it's solved for. Once you fix what you're willing to accept on payback, the target CAC and the cost ceiling at every funnel stage fall out of the math. That's the real value of building the model at all. It tells you exactly where those other numbers need to sit for the business to work.
That target isn't permanent, and it shouldn't be. It's built from your current best estimates of pricing, churn, and conversion rates, so recalculate it whenever those change enough to move ARPC or LTV.
CAC Payback Period
Formula: CAC ÷ average revenue per customer.
Company X: $667 ÷ $180 ≈ 3.7 months.
Payback asks a different question than LTV:CAC: not "is this customer worth it over time," but "how fast do I get my cash back."
When cash is tight, payback often matters more. A healthy ratio built on slow payback can still mean you run out of money before the math ever proves out.
Payback Benchmarks Vary by Deal Size, Not by One Flat Rule
"Under 12 months" is the number most guides repeat. It's a fine average and a poor target for any one company, because payback tracks closely with deal size — average contract value, or ACV.
Benchmarkit's 2025 data, from 342 companies' real 2025 results, shows median payback around 16 months, down from 18 months the year before. But the median hides a wide spread by deal size:
| ACV band | Typical median payback |
|---|---|
| Under $5,000 | ~9 months |
| $10,000–$25,000 | ~12 months |
| $25,000–$50,000 | ~14 months |
| $250,000+ | ~24 months |
ICONIQ's research goes further, noting payback can fairly run 20 to 30 months for long enterprise sales cycles. That's not a broken business — it's the cost of a longer sale.
A low-price, self-serve company holding itself to a 24-month target isn't pushing itself hard enough. An enterprise seller holding itself to a 9-month target is judging itself by the wrong yardstick.
Company X's contract is worth $2,160 a year — $180 times 12 — which falls in the under-$5,000 band, where a payback around 9 months is typical. Its actual 3.7-month payback is well under even the fastest band's typical figure — a third independent signal, alongside the ratio and the funnel headroom, that Company X has room to spend more.
Growth Efficiency: Burn Multiple and the Rule of 40
Both of these measure efficiency at the company level, not the customer level, and they matter at different stages. Treating them as the same thing is a common mistake.
Unlike CAC, LTV, and payback above, growth efficiency isn't part of the same funnel model — it's a separate, company-level check that sits alongside it, not underneath it.
Burn Multiple (Earlier-Stage)
Formula: net cash burn ÷ net new ARR, same period.
David Sacks, who made this metric popular, calls under 1.0x excellent, 1.0 to 1.5x good, 1.5 to 2.0x okay, and above 2.0x a warning sign worth a closer look.
Bessemer separately calls 1 to 1.5x attractive, specifically for early-stage companies. A company spending hard to grow is expected to burn some cash to add ARR; the question is how much.
Company X, at a later, larger stage than the funnel numbers above: $3M in net cash burn against $2.13M in net new ARR — ARR grew from about $3.87M to $6M, a 55% jump — which is a 1.4x Burn Multiple, inside Bessemer's "good" range for a company still spending hard to grow.
Rule of 40 (Later-Stage)
Formula: year-over-year growth rate, plus profit margin.
Investor Brad Feld popularized the Rule of 40 in 2015, framing it for SaaS companies "at scale" — his own example assumed at least $50M in revenue. That context often gets dropped when people apply the rule to much earlier companies.
Several sources, including Bessemer's own framework and commentary from Scale Venture Partners, say the Rule of 40 breaks down well before a company has real revenue and a stable margin, commonly put at under $5M to $10M in ARR.
Below that line, Burn Multiple is the more honest signal. Rule of 40 gets more useful once growth and margin are both big enough to hold steady month to month.
One thing worth naming, not glossing over: sources don't agree on which profit number belongs in the formula. Three different ones show up across guides — GAAP operating margin, non-GAAP EBITDA margin, and free cash flow margin — and boards argue over which one is right.
Whichever you pick, stick with it over time. The number matters far more as a trend than as one snapshot compared against someone else's differently defined 40.
Company X, at that same later stage: 55% revenue growth plus (–15%) EBITDA margin equals a Rule of 40 score of 40, right at the commonly cited bar, a fair score for a company still spending to grow, not optimizing for margin.
Real-world scores tend to run lower than the name "40" suggests. Aleph and Benchmarkit's full-year 2025 data puts the private SaaS median at 25%, up from 15% the year before, with the top quarter of companies clearing 43%.
A separate source, SaaS Mag, puts the public SaaS median closer to 28%. These describe two different groups, not a conflict, but a score in the 25 to 30% range is closer to normal than to failing.
Putting Company X's Numbers Together
| Metric | Company X | Commonly cited benchmark |
|---|---|---|
| CAC (fully loaded) | $667 | — |
| LTV | $3,600 | — |
| LTV:CAC | 5.4:1 | 3:1 floor; 5:1+ often signals under-investment |
| CAC payback | 3.7 months | ACV-dependent; ~9 months typical under $5K ACV |
| Burn Multiple | 1.4x | 1.0–1.5x "good," per Sacks and Bessemer |
| Rule of 40 (later-stage version) | 40 | 40 is the named bar; 25% is closer to the actual 2025 median |
Read one at a time, every number here looks fine, or better than fine. Read together, the story holds up: the LTV:CAC ratio, the funnel headroom, and the fast payback all point the same way.
Company X has room to spend a lot more on winning customers, without breaking its own math. That agreement across three separate signals is what makes the conclusion trustworthy, not any single number on its own.
Where the Standard Advice Breaks Down
- "3:1 LTV:CAC is the target." It's a floor, not a target. A higher ratio is a spending signal, not a scoreboard win.
- "Aim for under-12-month payback." Only right for one narrow slice of deal sizes. Check the table above first.
- "Track Rule of 40 from day one." Several sources say this metric doesn't work well before real ARR and a steady margin. Track Burn Multiple instead, until then.
- LTV built from revenue, not gross margin, overstates the number that actually matters. Treat it with doubt wherever you see it.
- A blended CAC number with no funnel breakdown tells you a result, not a cause. It can't tell you which stage to fix.
Common Mistakes When Calculating These Metrics
- Using blended CAC — ad spend only — instead of fully loaded CAC, for a real decision.
- Mixing new-customer spend with expansion or renewal spend in the same CAC number.
- Calculating LTV from revenue instead of gross profit, without at least checking how far apart the two numbers are.
- Using an enterprise payback target for a self-serve, low-price business, or the reverse.
- Treating Rule of 40 as meaningful before revenue and margin are both large and steady.
- Comparing your LTV:CAC ratio to a competitor's without knowing if they used blended or fully loaded CAC — the two numbers aren't comparable.
Limitations of This Guide
Every benchmark above is a median or a common range, not a rule for every company. GTM motion, industry, and pricing model can all shift what "good" looks like, in ways this guide can't fully capture.
The funnel method above shows where your CAC comes from, and what you can afford to spend, but it doesn't hand you the exact budget for each stage. That depends on your channel, your competition, and your creative, in ways no general guide can responsibly promise.
Once you build your own model, give it the same treatment. It's your best current estimate, not a fixed answer, and you should update it as real numbers come in.
One more reminder: Company X's funnel and pricing numbers throughout this guide come from the same Wegrowth SaaS unit economics calculator you can use for your own business.
The calculator doesn't calculate Burn Multiple or Rule of 40. Those numbers above are illustrative only, built separately for a larger, later-stage version of Company X. The calculator is built for the earlier stage most of its users are in, and below roughly $5M to $10M in ARR, Rule of 40 isn't a reliable signal anyway, for the reasons covered above.
Real companies will rarely have numbers this clean.
Unit economics is one slice of the numbers a SaaS company tracks. For the fuller set, see The Ultimate Guide to SaaS Growth Marketing Metrics.