Events & Metrics Dashboard Template

Give marketing, product and leadership one weekly report they can trust. Document and validate each analytics event, then follow your funnel, ad channels, subscriptions and MRR from a single sheet.

Events & Metrics Dashboard Template

About the Events & Metrics Dashboard Template

Reliable reports depend on reliable tracking, and this template covers both. The Events sheet is an event tracking plan template that documents what you track and how. The Metrics sheet turns that data into a weekly view of your funnel, ad channels and revenue.

With this template, you can:

  • List each metric with its description, tracking tool and implementation.
  • Check off whether each event is on the dashboard, in GA and GTM, and validated.
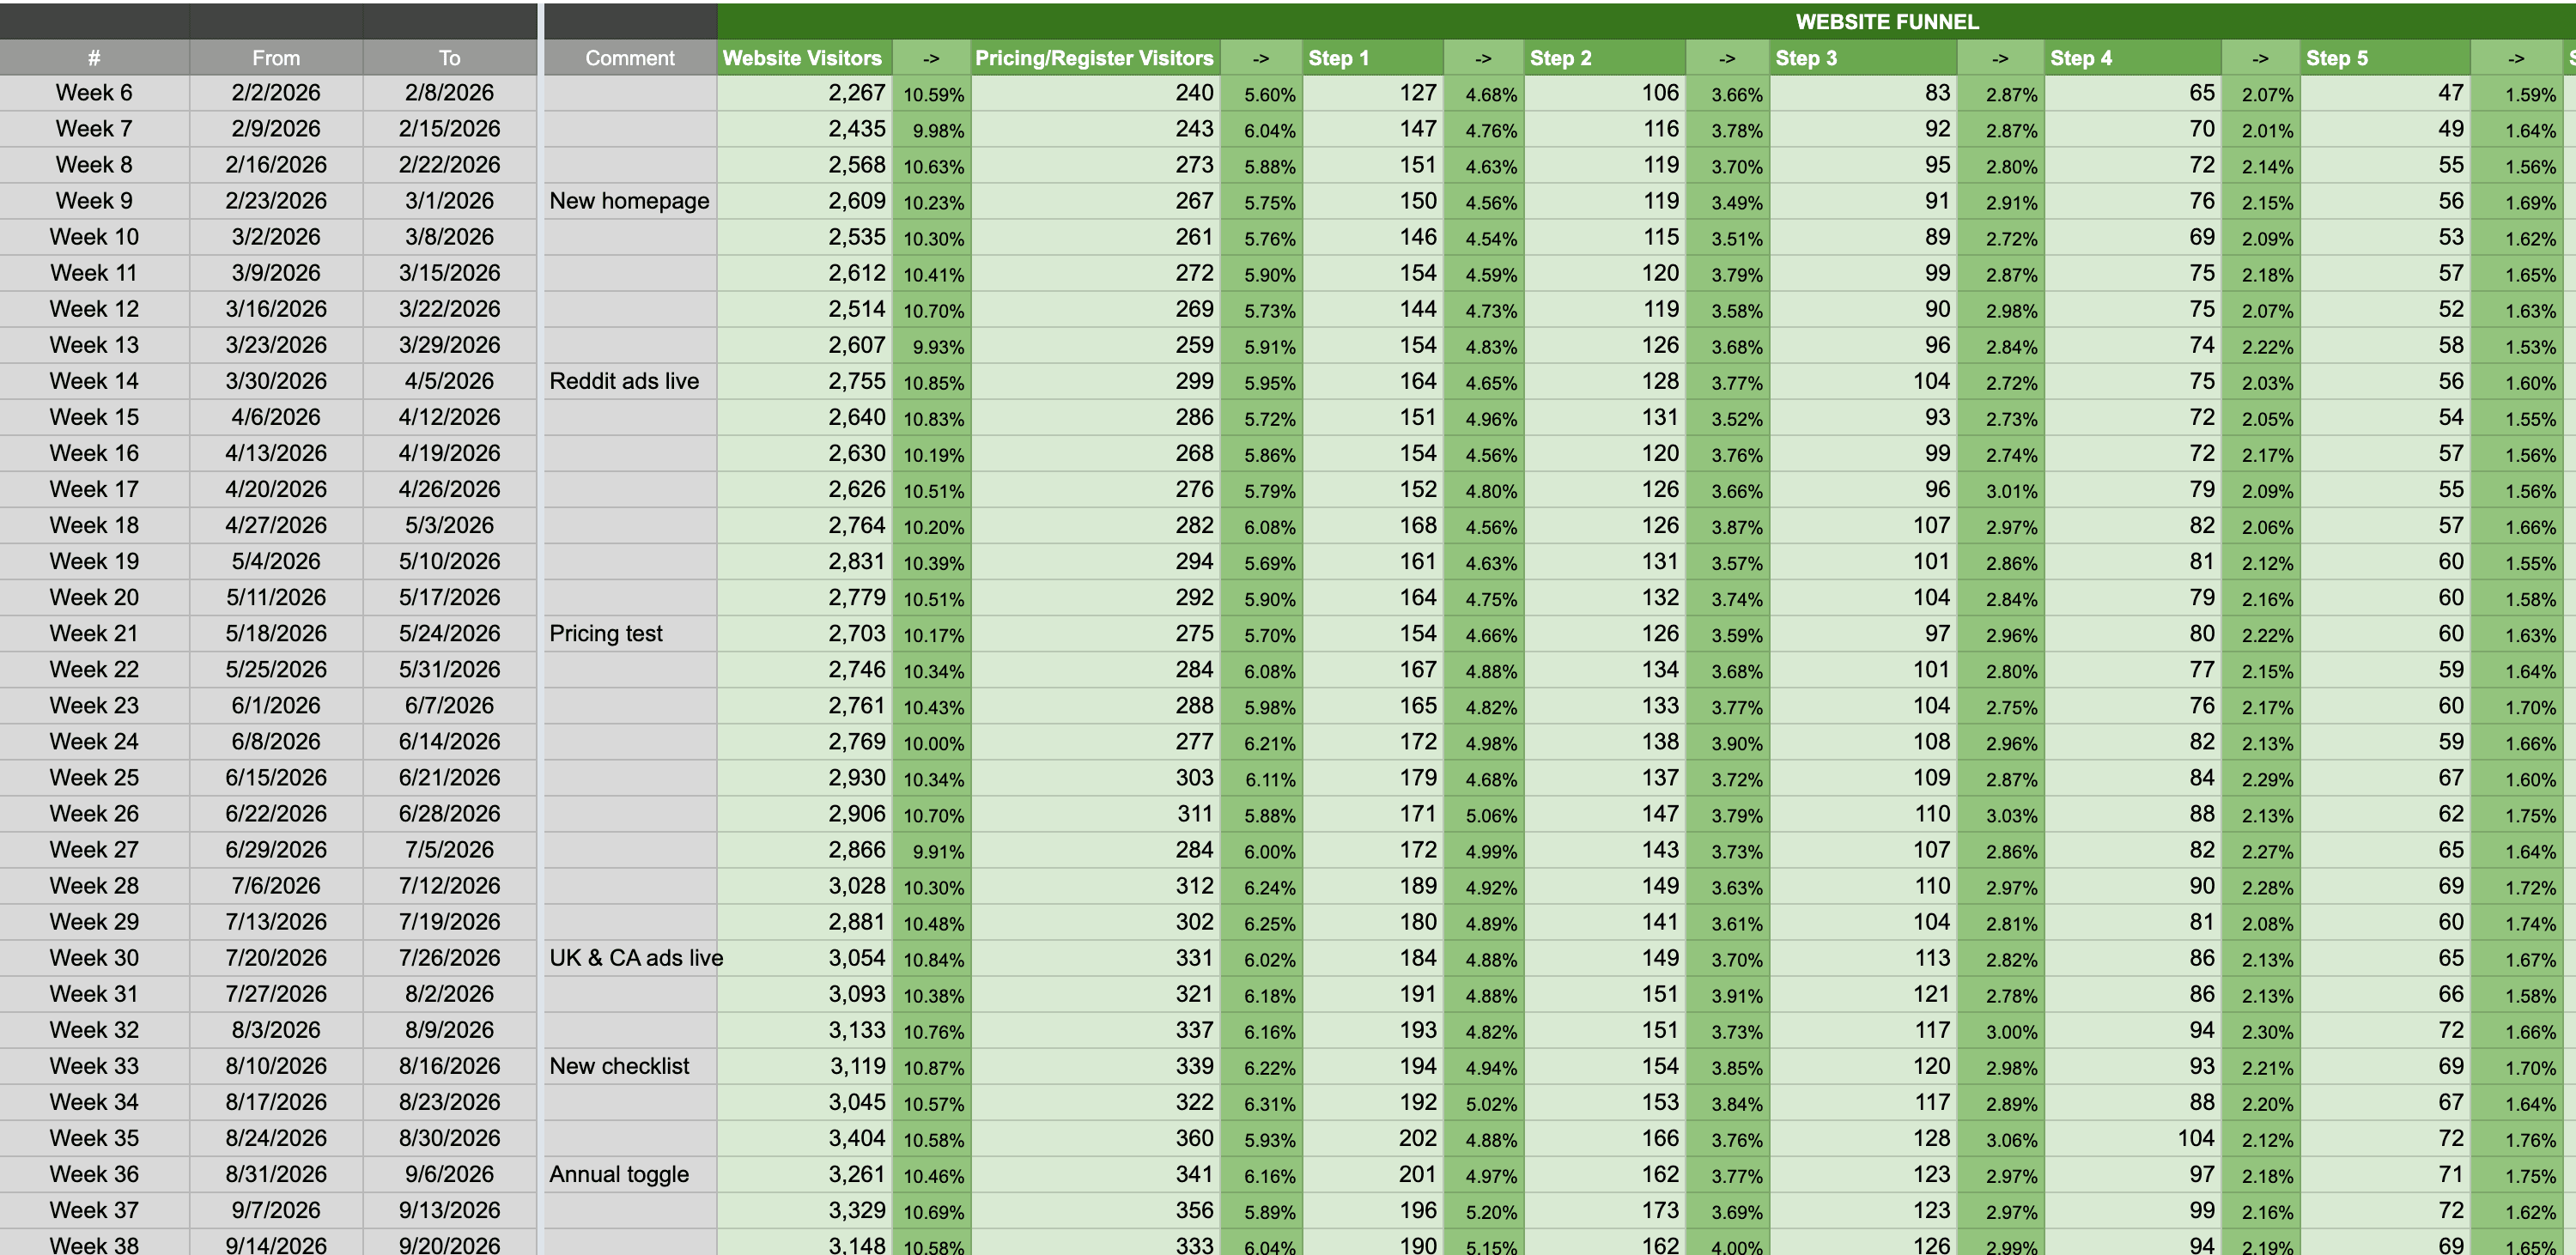
  • Track your funnel weekly, from website and pricing page visitors to conversions.
  • Compare Facebook, LinkedIn, Google and Reddit ads on spend, CAC, revenue and ROAS.
  • Report new subscriptions, renewals, upgrades, refunds and MRR movement.

Benefits of Using Our Events & Metrics Dashboard Template

  • Find gaps in your tracking before they show up as missing data in reports.
  • See where visitors drop off between funnel steps.
  • Compare ad channels on CAC, instant profit and ROAS.
  • Follow MRR through each period: new, expansion, reactivation and churned MRR.
  • Give marketing, product and leadership one weekly report.

How to Use This Template

  1. Download the "Events & Metrics Dashboard Template".
  2. In the Events sheet, list the metrics you need and the tool that tracks each one.
  3. Note how each event is implemented, and mark it validated once it fires correctly.
  4. Rename the funnel steps in the Metrics sheet to match your signup or onboarding flow.
  5. Add a row each week with your funnel, ad, subscription and MRR data.
  6. Use the comment column to note launches, changes or anything that explains a shift.

Tracking You Can Trust in Your Reports

Weekly numbers are useful only when the events behind them fire correctly. The Events sheet turns tracking into a checklist: each metric gets a tool, an implementation note and a validated flag.

When a number in the Metrics sheet looks wrong, you can trace it back to the event that feeds it.

To set up tracking and reporting with an expert team, explore our web analytics implementation services or get started with our free growth marketing plan.
FAQ

What is an analytics event tracking plan?

In analytics, an event is a user action your tools record, such as a page view, a sign-up or a payment. An event tracking plan lists every event and metric you track, what each one means, which tool records it and how it is implemented. It is the shared reference that keeps product, marketing and engineering aligned on what a number means.

In the WeGrowth Events & Metrics Dashboard Template, the Events sheet covers funnel, onboarding, ad and Stripe metrics. Each row has a description, the tracking tool and an implementation note, plus checkboxes for the dashboard, Google Analytics, Google Tag Manager and validation.

How do you track onboarding steps with Google Tag Manager?

Push a dataLayer event from your product at the moment each step happens, for example dataLayer.push({event: 'step_1'}). Then set up three things in Google Tag Manager:

• A trigger for each dataLayer event, such as a Step 1 trigger for step_1.
• A GA4 tag for each step that sends the event to Google Analytics.
• A new_conversion event with a conversion tag for each ad platform.

Test each event in GTM's preview mode before you rely on it. The Events & Metrics Dashboard Template lists the code and the GTM checklist for six onboarding steps.

How do you track ad conversions and ROAS across channels?

Send every conversion to each ad platform with its pixel or conversion tag, then report the same metrics per channel: traffic, spend, CPC, conversions, conversion rate, CAC, revenue, profit and ROAS.

Profit is the revenue attributed to a channel minus its ad spend. ROAS is revenue divided by ad spend. Each channel's share of signups shows which one carries your growth.

The Events & Metrics Dashboard Template does this for Facebook, LinkedIn, Google and Reddit, and its GTM checklist covers the conversion tags, the pixels and the Google Conversion Linker.

Which SaaS subscription and MRR metrics should you track?

Track how much revenue you add, keep and lose each period:

• New subscriptions: count, revenue and ARPU, by monthly and yearly plan.
• Renewals: monthly and yearly renewals and their revenue.
• Upgrades and upgrade revenue.
• Gross and net revenue, plus refunds and refunded revenue.

For MRR, track start MRR, new MRR, reactivations, expansion, churned MRR and end MRR, plus MRR churn % and MRR growth. New net MRR sums those movements after churn. The Events & Metrics Dashboard Template tracks all of these from Stripe.

How do you validate event tracking?

Confirm that each event fires and records data correctly before you report on it. An event can be listed in a tracking plan and still fail in production, for example after a release changes a page or a button.

Mark each event as validated once you have tested it, and note fixes or known gaps next to it, so anyone reading the dashboard knows which numbers they can trust and when a number changed because tracking changed. The Events & Metrics Dashboard Template has a Validated column and a comment column for this.

Which funnel steps should a SaaS product track?

Track every step from first visit to conversion: website visitors, pricing or signup page visitors, the key onboarding or adoption steps, and new conversions. Name the onboarding steps after real actions in your product, such as account created, first project set up or teammate invited.

The Events & Metrics Dashboard Template tracks visitors and pricing or register page visitors in Google Analytics, six onboarding steps through Google Tag Manager, and conversions. Rename the steps to match your flow, then update the matching dataLayer events and GTM triggers.

Is the Events & Metrics Dashboard Template free?

Yes. WeGrowth's Events & Metrics Dashboard Template is free. It is a Google Sheet: make a copy to edit it in Google Sheets, or download your copy as an Excel file with File > Download > Microsoft Excel (.xlsx).

Let's Accelerate Your SaaS Growth

If you found this template helpful or need expert support across any aspect of your SaaS growth—strategy, analytics, conversion optimization, marketing, or more—we've got you covered.

Get Free Marketing Plan